It’s been a long time since global wars and recession have joined hands. Yet, with two major wars that each have the potential of becoming world wars, we also hear the drumbeats of recession growing very close now. Today’s economic reports were full of recession. We have also never faced so many bubbles blown up to such enormous sizes that are deflating together, which is where the potential lies for a deep recession.
Some real investment advice
First up: an article from Lance Roberts of Real Investment Advice, whom I find to be a neutral voice generally on which way the market or economy is heading — meaning one who just goes by the charts and numbers with no tendency to lean bearish or bullish beyond what the numbers show. Today he writes,
I previously discussed a slate of recessionary indicators with high correlations to recessionary onsets. However, as we head into 2024, many Wall Street economists predict a “soft landing” or “no recession” outcome for the economy. Are these recessionary indicators with near-flawless track records wrong this time? Will it be a soft landing in the economy or something worse?
He goes over a couple of his primary indicators and comes up with the following:
We must start our recessionary indicator review with the “Godfather” of them all – “Yield Curve Inversions….” Regarding yield curve inversions, the media always assumes this time is different because a recession didn’t occur immediately upon the inversion…. The inversion is the “warning sign,” whereas the un-inversion marks the start of the recession, which the NBER will recognize later. While most mainstream economists focus on a specific yield curve, we track ten different economically important spreads…. Most yield spreads we monitor … are inverted, which is historically the best recessionary indicator. Given the massive increase in activity due to a shuttered economy and massive fiscal stimulus, the reversion may take longer than expected.
Just as I said the yield curve would be slow in arriving to the party by inverting in 2022, and then it arrived after we started into the technical recession of 2022, I’ve also said it will be slow in leaving the party — last one out the door — probably reverting right as the deeper part of this recession gets underway.
The reasons for that are simple: The Fed has so messed up the yield curve by manipulating it with massive bond purchases for years and now massive bond rolloffs, that the Feds massive manipulation in both buying and dumping has to get out of the way before the yield curve can show natural market truth.
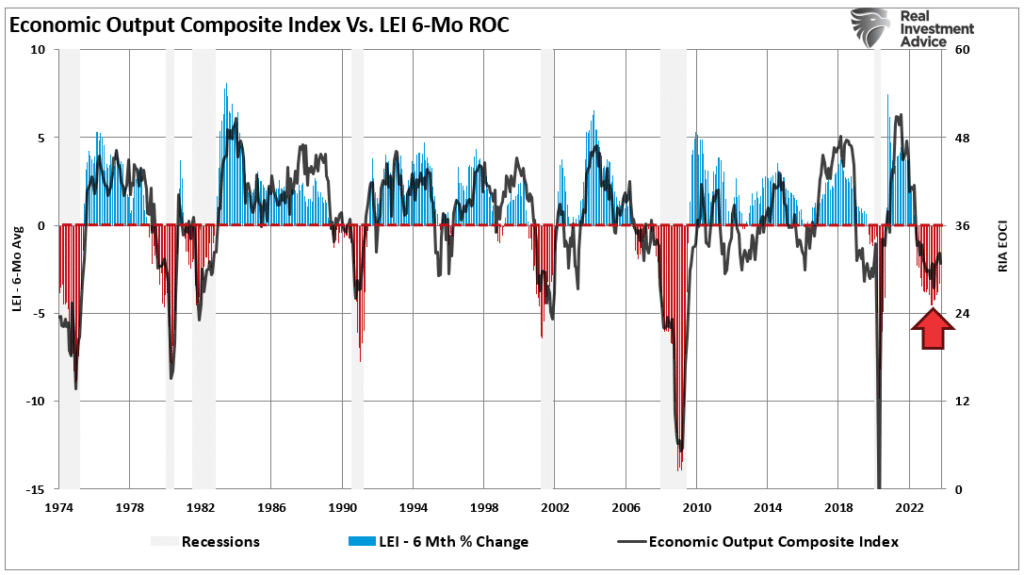
The Economic Composite Index, comprised of 100 hard and soft economic data points, clearly shows the economic cycles. I have overlaid the composite index with the 6-month rate of change of the LEI index, which has a very high correlation to economic expansions and contractions:”

Roberts also notes,
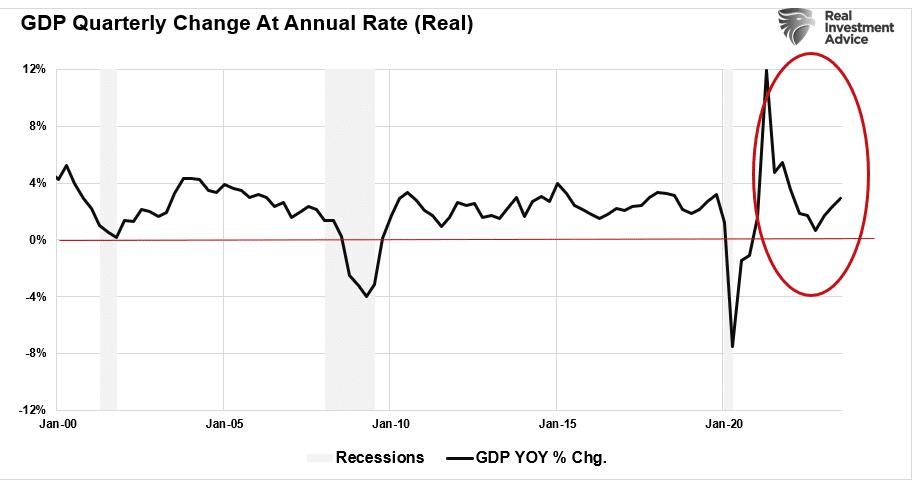
As noted previously, we would already be in a recession if we had entered this current period at previous growth rates below 4%. The difference is the contraction began from a peak in nominal GDP of nearly 12%. As noted above, a bounce in activity is not surprising after a significant contraction in the economic data. The question is whether that bounce is sustainable. Unfortunately, we won’t know the answer for quite some time.

Except, I think it won’t be as long as he thinks until we know.
In terms of the lag effect for Fed actions that have already taken place, he says,
We know that Federal Reserve actions regarding hiking rates have about a 6-quarter lead over changes to economic growth. Given the last Fed rate hike was in Q2 of this year, such would suggest a further slowing in economic activity into the end of 2024.
I think we are seeing a lot of that now, as I’ve pointed out in recent articles, and will provide additional evidence for in this article.
The Fed knows all about the lag time and is counting on further slowing to continue through the end of 2024. It has said as much many times; so it is ludicrous for investors to think the Fed would lower rates when this continued decline due to its own lag effect is exactly what the Fed keeps saying it wants to see and believes it will see. Therefore, the Fed will not pivot as the market believes unless things break so badly that the breakdown, itself, causes the market to fall off a huge cliff, which is hardly a reason for the market to be rising now due to belief in a “Fed pivot.” That merely raises the height of the cliff it is going to fall from.
Lance concludes,
Yes, this “time could be different.” The problem is that, historically, such has not been the case.
Manufacturing a recession
Another lousy manufacturing survey came in today, pounding the same beat other surveys have been hammering. As a solitary counter-beat, we did get a survey out of Chicago this week that was the equivalent of a bumper crop. I’m calling it anomalous, though, because all other surveys of its kind have shown metrics that say their own regions are fully in recession already. Today we got more backup to those other surveys from S&P Global's US Manufacturing PMI, which dropped to 49.4 (recessionary) from 50.0 (neutral) in October.
Likewise,
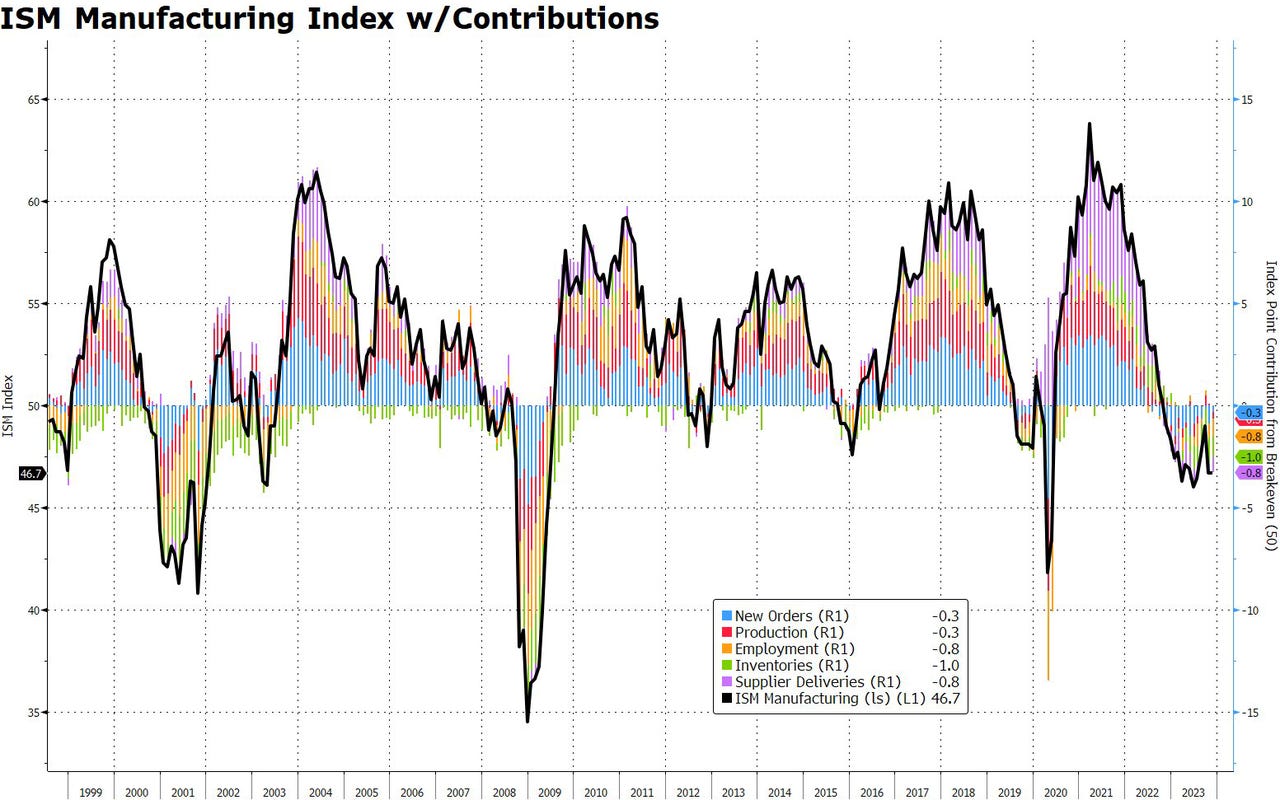
The ISM Manufacturing PMI was expected to improve … but it disappointed, printing 46.7 (the same as October's final print), below the 47.8 expectations…. All subsectors of the ISM report contributed negatively.
Zero Hedge referred to these measures as “stagflationary recession” signals. That, of course, is exactly the kind of recession I’ve consistently said this will be. So, the data is coming in as expected here, except for that one-off from Chicago.
ZH shows a graph that looks a lot like Lance’s Economic Output graph above, except that this graph follows up on the final segment of Lance’s graph, which showed an upturn, with with strong evidence the upturn didn’t hold:

Lance’s Economic Output graph showed the hint of a downturn after the upturn, but here we see a more severe one, heading right back down into deeper recession. While they are graphing different things, they are corollaries. Given how well they usually synch up with each other, I would expect the Economic Output graph to match down to this one.
The survey also showed that manufacturers’ prices have started rising again.
Survey espondents reported,
“A slow fourth quarter, and we’re clearly in a mild industry recession...” [Fabricated Metal Products]
“Economy absolutely slowing down. Less optimism regarding the first quarter of 2024.” [Chemical Products]
"US manufacturers reported yet another tough month in November. Output barely rose as inflows of new work showed a renewed decline, hinting at little – if any – contribution to fourth quarter GDP from the goods-producing sector.
And the worst sounding response was …
“US producers nevertheless continue to focus on cost cutting by trimming headcounts, and have now taken the knife to payroll numbers for two consecutive months.
Barring the early months of the pandemic, the survey has not seen such a back-to-back monthly fall in factory employment since 2009.
As to where this will likely put fourth quarter GDP growth:
The past relationship between the Manufacturing PMI® and the overall economy indicates that the October reading … corresponds to a change of minus -0.7 percent in real gross domestic product (GDP) on an annualized basis
Recessionary.
Even the Fed says recession
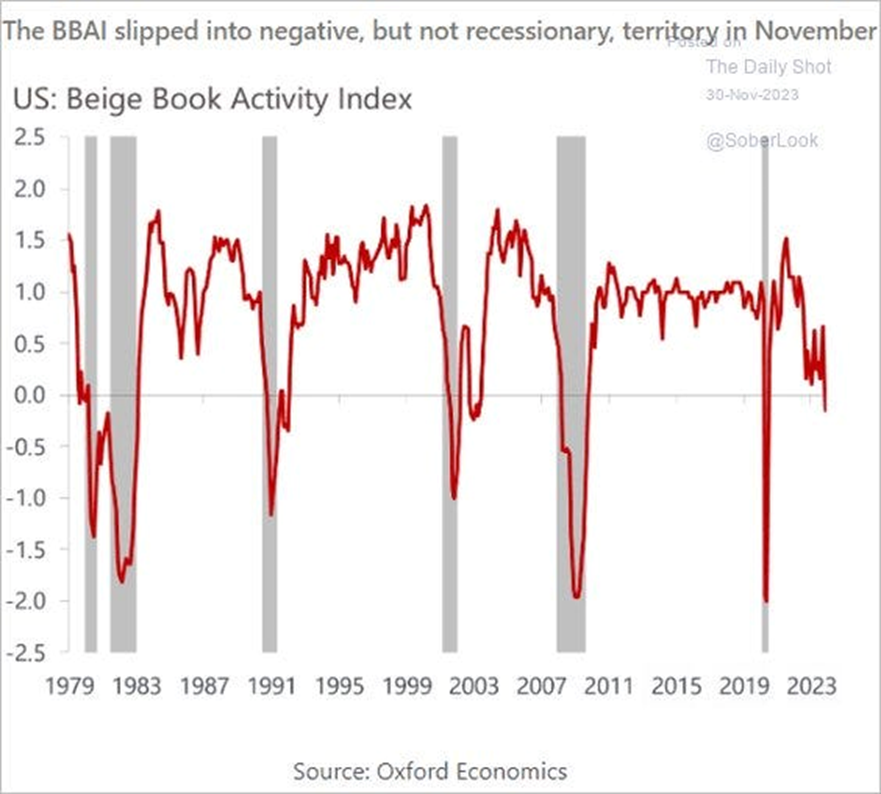
Finally, the Fed’s famous and much-watched Beige Book put in a matching report today:

The Beige Book has gone into contraction for the first time since the short Covid Lockdown recession of 2020. It only goes down during recessions, and anything below 0.0 is actually recessionary. As you see, almost all recessions have been eventually declared to have started as soon as the Beige Book dipped below 0.0
So, it is recession all the way in the news today. Believe otherwise, if you want; I’m just going where I find the bulk of the evidence now points.


