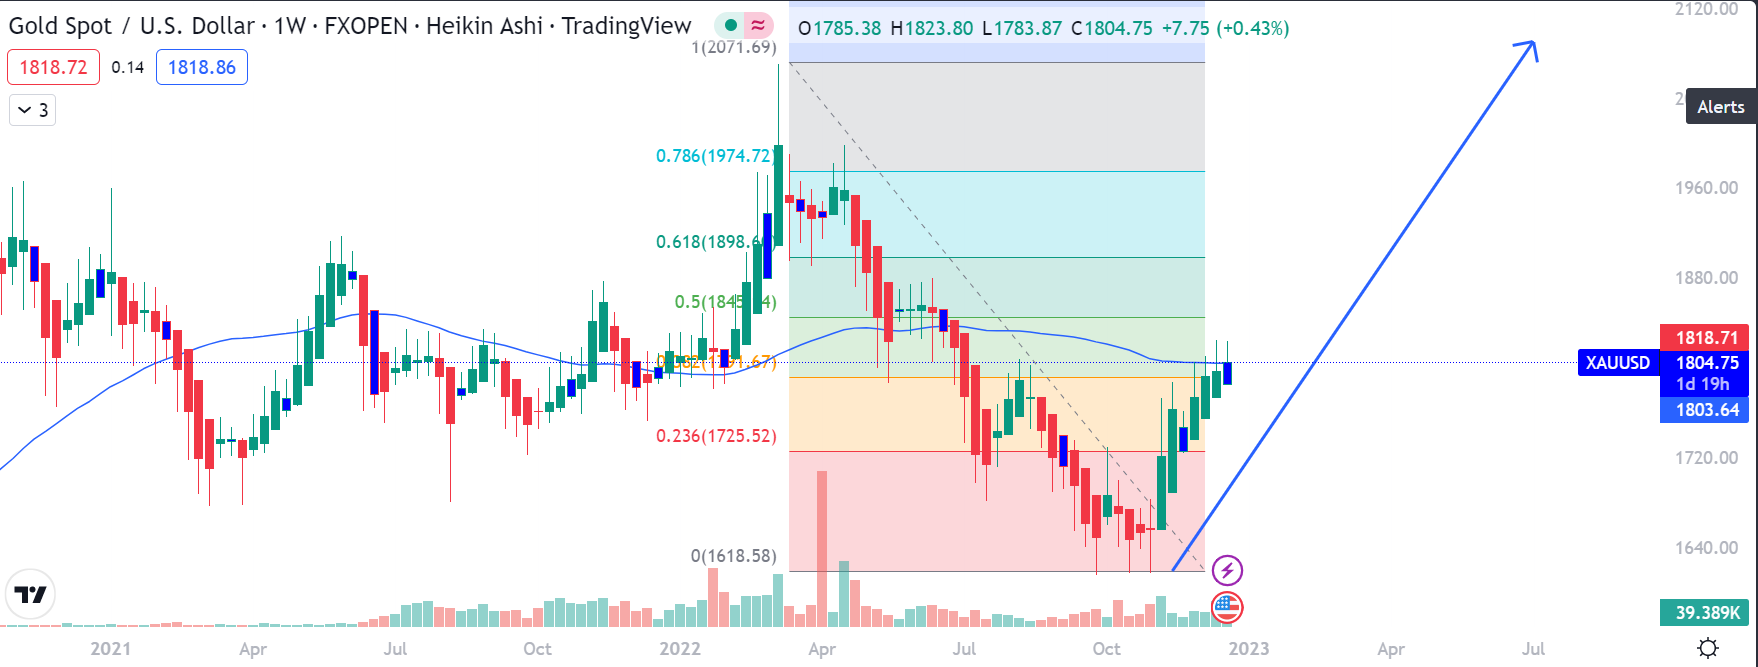
- Spot gold has to trade over $1819.00 to continue its rise.
Spot gold, Where is it headed? Will it break past $2200-$2300 zone by March 2023?

- Spot gold can rise to $2022.80 and $2252.30 anytime in the first quarter of 2023 as long as it trades over $1684.90.
- All price fall upto $1684.90 is a part and parcel of the bullish trend.
- Crash or sell off in spot gold will be there only if it does not break $1901.60 by 10th February 2023.
- 100 day MA: $1721.70.
- 200 day MA: $1784.10.
- 200 week MA: $1707.40.
- Mild sell off will be there if spot gold falls below $1784.10 anytime before the release of US December nonfarm payrolls on 6th January 2023 to $1721.70.
- I am bullish on gold for Q1 and expect it to break past $2300 before end of March 2023. I will prefer to use a buy on crash strategy as long as spot gold trades over $1680-$1700 zone.
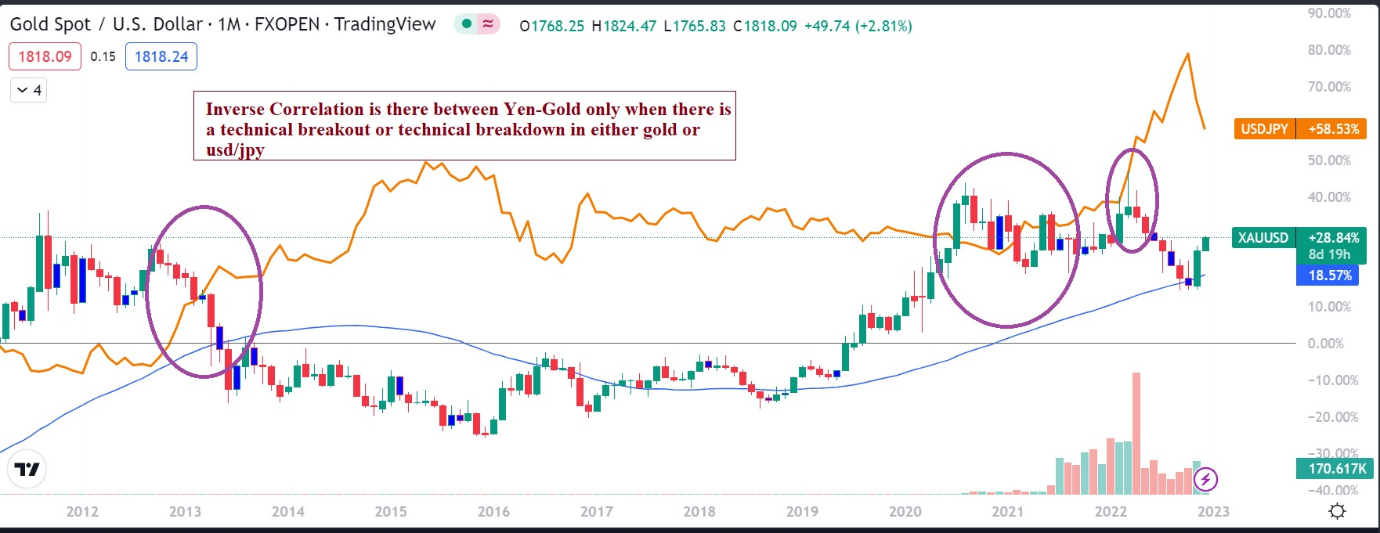
Yen/Gold correlation

- Yen (usd/jpy) correlation works only when there is a technical breakout or technical breakdown in either usd/jpy or spot gold/cme gold future.
- This correlation does not work in a range bound price move. If yen and gold range trade, then the yen/gold correlation is a failure.
- There has to be a one way price move in both usd/jpy or even either in gold or usd/jpy for the correlation to work.
- Yen gold correlation if understood properly will also give us the short term tred and medium term trend.
TODAY
Trend and momentum is very bullish for gold, silver, and copper. One needs to look for signs trend reversal after the release of US third quarter GDP number and Core PCE price of Q3. A lower than expected US Q3 GDP will cause another big wave of rise in gold, silver, and copper accompanied by sinking of the US dollar index.
Traders will start taking positions for the first week of January after the release of key US economic data release. Long term position squaring and rebuilding is still going on after the Bank of Japan indirect interest rate hike this week.
Spot Gold:
- Daily support: $1790.10 and $1803.00.
- Daily resistance: $1826.70 and $1864.40
- Gold faces resistance between $1819-$1827 zone. It needs to break and trade over this zone to rise to $1819-$1827 zone to zoom to $1843.70 and $1883.20.
- Crash or sell off will be there only if spot gold does not break $1827 before days close.
- Overall gold is bullish as long as it trades over $1790.00.
Spot Silver :
- Daily Support: $23.60
- Daily Resistance: $24.50 and $25.02
- Spot silver has to trade over $23.60 to rise to $24.50 and $25.88.
- There will be sell off only if silver trades below $23.60.
|
COMEX FUTURES DAILY TECHNICAL |
||||
|
|
Gold Feb 23 |
Silver March 23 |
Copper March 23 |
Nymex Crude oil |
|
CMP |
$1,828.65 |
$2,424.00 |
$384.05 |
$78.67 |
|
S5 |
$1,778.75 |
$2,245.00 |
$367.15 |
$69.88 |
|
S4 |
$1,790.73 |
$2,287.96 |
$371.21 |
$71.99 |
|
S3 |
$1,803.70 |
$2,334.50 |
$375.60 |
$74.28 |
|
S2 |
$1,809.59 |
$2,355.62 |
$377.59 |
$75.31 |
|
S1 |
$1,816.87 |
$2,381.76 |
$380.06 |
$76.60 |
|
|
|
|
|
|
|
R1 |
$1,840.43 |
$2,466.24 |
$388.04 |
$80.74 |
|
R2 |
$1,847.71 |
$2,492.38 |
$390.51 |
$82.03 |
|
R3 |
$1,853.60 |
$2,513.50 |
$392.50 |
$83.07 |
|
R4 |
$1,866.57 |
$2,560.04 |
$396.89 |
$85.35 |
|
R5 |
$1,878.55 |
$2,603.00 |
$400.95 |
$87.46 |
|
Breakdown level |
$1,816.18 |
$2,379.25 |
$379.83 |
$76.47 |
|
Breakout Level |
$1,841.13 |
$2,468.75 |
$388.28 |
$80.87 |
|
CMP= Current price market price |
||||
|
ABOVE TECHNICALS ARE ONLY FOR REFERENCE |
||||
COMEX GOLD FEBRURY 2023
- Key price to watch: $1800.50
- Gold has to trade over $1813.60 today to rise to $1875.30.
- Gold will rise very quickly if it trades over $1837 today and more so in USA session.
COMEX SILVER MARCH 2023
- Key price to watch $2377.00
- Silver has to trade over $2377 to rise to $2500 and $2598.
- Silver will crash only if it trades below $2377.
NYMEX CRUDE OIL (February 2023)
- Crude oil needs to trade over $76.00 to rise to $82.50 and $86.80.
- Sell off will be there only if crude oil trades below $76.00.
COMEX COPPER MARCH 2023
- Copper can rise to $397.90 as long as it trades over $377.00.
- Sellers will be there if copper trades below $377.00 initial support. +
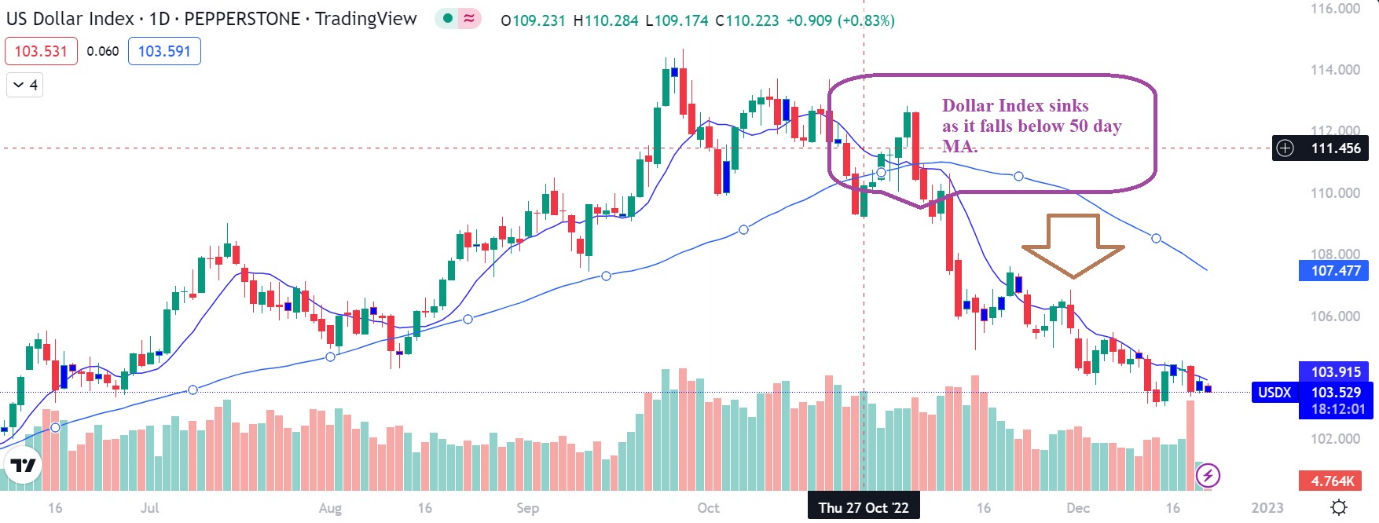
US DOLLAR INDEX IS TRADIND BELOW 50 DAY MOVING AVERAGE – bullish for bullion

- 50 DAY MA: 107.30
- 100 DAY MA: 108.60
- 200 DAY MA: 105.70
- 50 WEEK MA: 104.10
- 100 WEEK MA: 98.50
- 200 WEEK MA: 97.40
- US dollar Index is trading below 50 day, 100 day, and 200 day MA. This is bullish for gold and silver.
- If US dollar index trades below key moving average after December nonfarm payrolls on 6th January 2023, then it spot gold will break past $2000 and also trade over $2000 in January.

