The segment’s title might also read “Another Week, Status Unchanged”, as it has been for so long now. That status targets “to or through the election” [for the broad bull rally], as it has all year long (with a few caution points along the way).
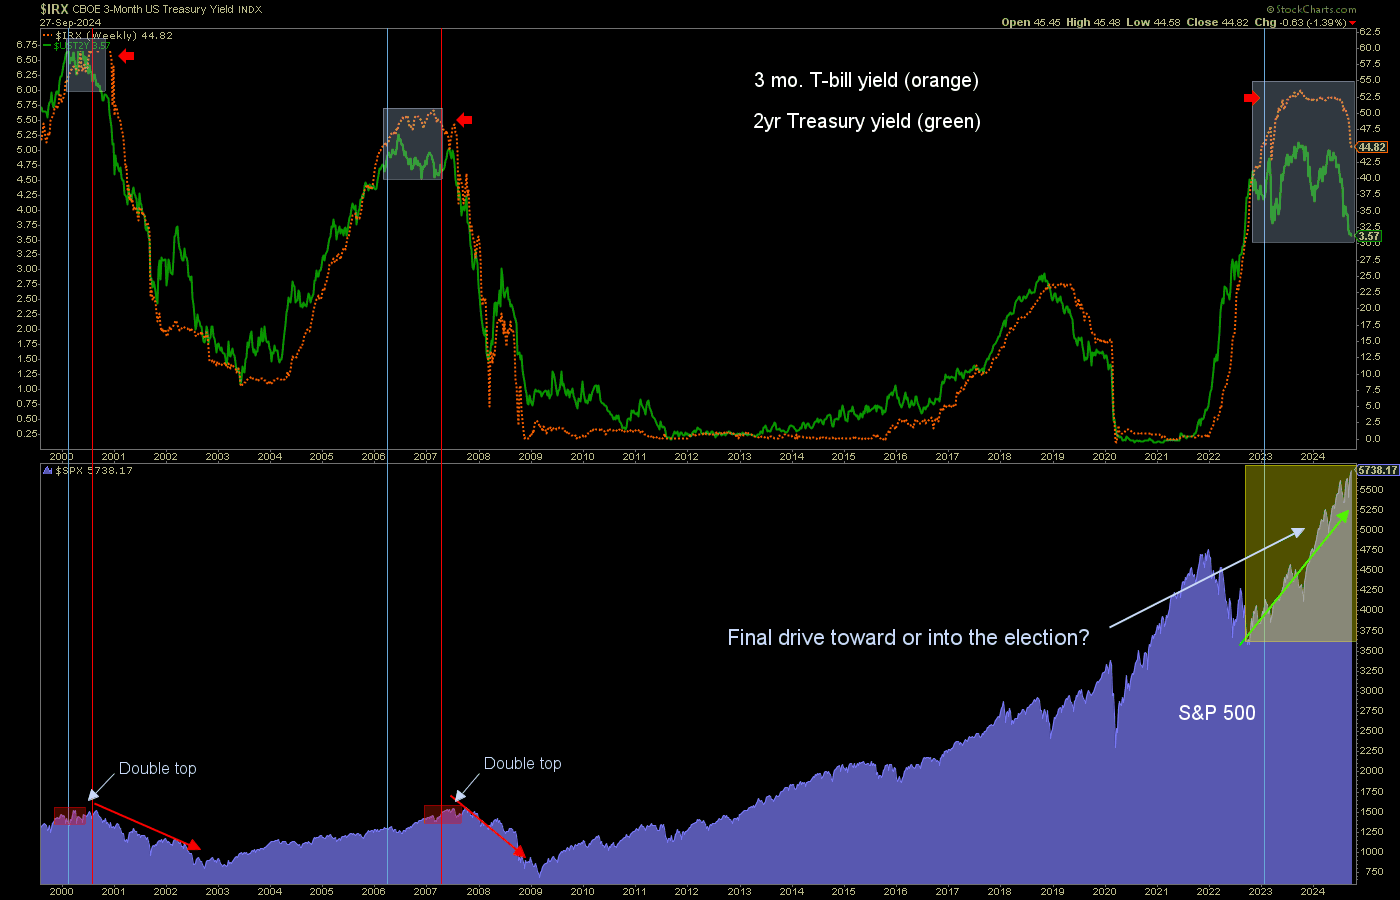
I’d like to go back to one of my favorite charts illustrating the macro situation of 2024. While some are giddy (the casual public “playing” a stock market that always goes up, eventually), some are pissed (those who have staked their marketing schemes, and thus their reputations, on a perma-bearish view) and some are bewildered (mainstream investment houses retooling their outlooks in lagging fashion with every interim macro event/turn), we simply follow our guides, like the 2 year Treasury yield’s divergence to the (Fed proxy) 3 month T-bill yield, which is now finally starting to adjust to the divergence, as expected.
 So the anticipated yield dynamic is in progress and the stock market is on our original message, with the US presidential election a little over a month away. The green arrow on the chart is the very picture of the risk we keep highlighting and that risk has progressed to an alarming state with SPX continuing upward and T-bill yields having turned down. At least that is the message of the run-ups to the last two major bear markets, in 2000 and 2007.
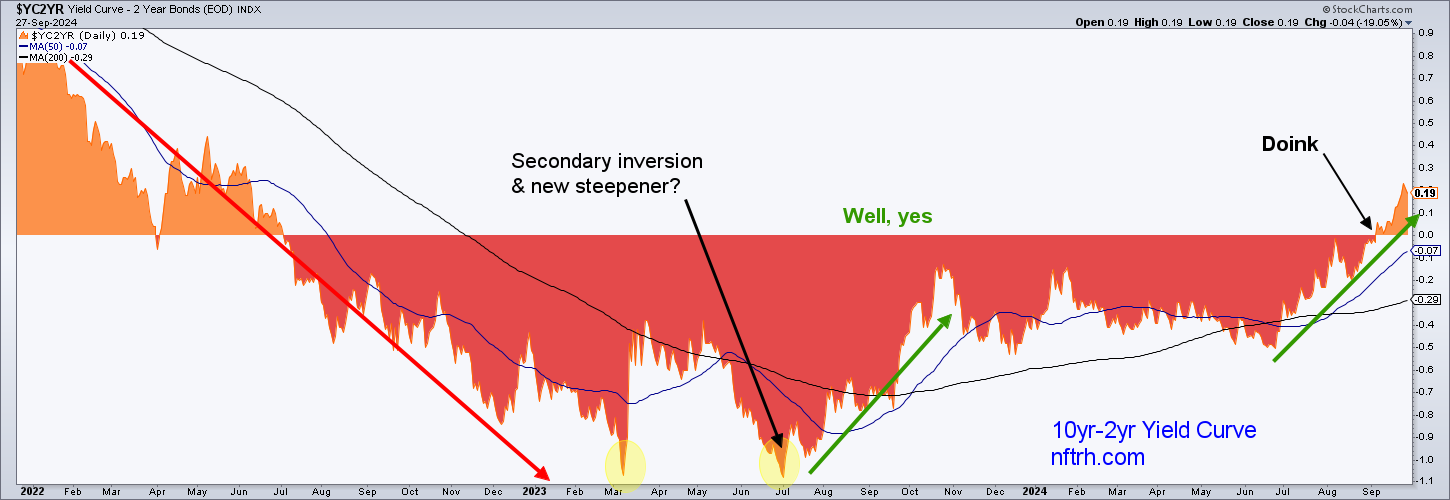
Sure, anything can happen. But history is what it is. It could be different this time. But the setup projects an epic heartbreak for today’s FOMOs, MOMOs, and come-lately Goldilocks adherents thinking we dodged a recessionary bullet because the yield curve is finally un-inverted, eliminating the recession signal that had held so many in caution mode for so long.
Oops, that dangerous media brain fart is likely to cost anyone who takes it seriously.
“Bond Market Yield Curve Returns to Normal”? Signals for Gold, Stocks, Economy
The public post above explains that which I’ve been harping upon since 2022 when the media made such a ruckus about the 10-2yr yield curve inversion and its supposedly imminent recessionary signal; it’s not the inversion that historically kills the boom, it is the subsequent steepener. Ladies and Gentlemen, allow me to reintroduce to you our brand spanking new un-inverted yield curve steepener.
 Let’s now introduce some gold discussion, as gold is the asset (IMO) that will ultimately prevail in the developing macro. However, if we can leave aside our mentalities as casino patrons, we may realize two things…
- Gold (target 3000+) is also extremely stretched and at risk, price-wise, as well.
- Gold’s price should rise dramatically vs. bubble assets in the coming years if a “post-bubble” macro develops after the risk portrayed in the first chart above plays out.
Where the broad markets are concerned, I want to be aware of the risk signals and also aware that I am doing something un-Gary-like in accepting such risk. The clock is ticking, if we assume that past facts of history will extrapolate to a coming fact of realized risk. A risk that has been building on itself all year. In my opinion, we are in the final stages. That sentence is written by someone who has been compelled to lean bullish all year long and has zero short positions, currently [but outsized positions in cash and short-term Treasury bonds to go along with very moderate long exposure]. That someone is also watching events closely from here on.
As always, the Portfolios segment will illustrate what I hold in the current macro. Of late we have expected rotations to include commodity and resources-related areas. Think about a bull phase that rounds up everybody and includes them before it finally flames out. I’ll stick with “to or through the election”, but things are in progress now that would probably beg us not to be the least bit complacent or lenient with the “through the election” phase, assuming the rally even gets to the election.
#829 then went in-depth on the precious metals and especially the gold mining sector, covering sector fundamentals, internals, and technical analysis from short through long-term perspectives.

