
Are the hurricanes our black swan event we've been looking for and expecting? Read on for our conclusions. This past week also saw the U.S. inflation numbers and Canada's job numbers. Inflation moderating? Canada's job numbers looked really good. Are they?
That the stock market is overvalued is an understatement. We look at one valuation model for our Chart of the week.
Once again markets surged to all-time highs. Well some, but not all markets. Continuing divergences and warning signs abound that we are in the topping phase. Gold and gold stocks were up but many other precious metals were not. Lundin Gold, for example, doubled its quarterly dividend, reported record quarterly revenue, record EBITDA, and significant cash flow, and is held in the Enriched Capital Conservative Growth Strategy.* Another divergence? Correction phase still in progress? We do remain bullish but short term cautious. Oil up but not a lot as we await what might happen between Israel/Iran. Still energy looks bullish.
It's Thanksgiving here in Canada and Monday markets are closed. U.S. markets open but it might be slow for Columbus Day.
Happy Thanksgiving!
Have a great week.
DC
* Reference to the Enriched Capital Conservative Growth Strategy and its investments, celebrating a 6-year history of strong growth, is added by Margaret Samuel, President, CEO and Portfolio Manager of Enriched Investing Incorporated, who can be reached at 416-203-3028 or msamuel@enrichedinvesting.com
“Some doomsayers think the collapse will be triggered by runaway government spending, excessive taxation, oppressive regulation, food shortages, fuel shortages or natural disasters such as deadly pandemics or lethal changes in the world's climate.”
—Robert Higgs, American economist, economic historian, Austrian school of economics, author of The Transformation of the American Economy, 1865–1914 (1971) and others; b. 1944
“Rising sea levels, severe draughts, the melting of the polar caps, the more frequent and devastating natural disasters all raise demand for humanitarian assistance and disaster relief.”
—Leon Panetta, American politician, U.S. Secretary of Defense 2011–13, director of the CIA 2009–2011, White House Chief of Staff 1994–1997, Director Office of Management & Budget 1993–1994, U.S. representative California 1977–1993; b. 1938
“I've been through natural disasters. I lived down in Miami and was down there for Hurricane Andrew which was a Category 5. There were members of my family that thought they were going to die. Everyone was in the bathtub.”
—Dwayne Johnson, professional wrestler aka “The Rock”, actor, businessman, co-owner of the United Football League; b. 1972
Florida and the Hurricanes

Could the double whammy of Hurricanes Helena and Milton be the black swan event we’ve been expecting? Or maybe it’s just one of a few more that could still happen; i.e. Israel bombing Iran’s oil or nuclear facilities. Naturally, at this stage it may be too early to tell just what economic impact the hurricanes will have on Florida’s economy and their impact on the U.S. economy by extension. Florida is the third largest state by population in the U.S. with some 22.6 million people. Florida’s GDP, at an estimated $1.3 trillion (2023), ranks Florida as the fourth largest economy in the U.S. If Florida were a country, it would rank around fifteenth in the world, roughly equivalent to Mexico or Spain. A hit to Florida’s economy could have a negative impact on the GDP of the U.S.
While final numbers are not available, it is estimated that Florida suffered damage of at least $48 billion from Helena. Of the $48 billion in damage, at least $20–30 billion of that is not insured. Then we saw from FEMA that federal assistance just for Helena alone could exceed $210 billion. Just where are they going to get the money? Print more?
Many property owners have been wiped out because they had no insurance. That number was estimated around 15–20%. Irrespective of this, many could be at risk of still having to pay substantially to rebuild, less anything they may get from insurance or the government (FEMA). At the time of writing, we had no good indication of what the cost of Hurricane Milton would be, but it is expected to be substantial. One early estimate was $100 billion in insured losses alone. Many insurance companies are teetering on the brink of bankruptcy and may not be able to pay all their claims.
The actual costs could climb a lot higher once the impact of lost business, lost jobs, and more is taken into account. Some of the costs could be lessened with payouts from FEMA under the National Flood Insurance Program (NFIP). But even FEMA is facing funding issues. Also, much of the damage from Milton was not necessarily from storm surge as many expected but wind damage, particularly from some 53 tornadoes that were spawned at the same time. The tornadoes struck not on the Gulf of Mexico side but more in central Florida. Some three million are without power. It could be days, weeks, or even months before power is fully restored. Clean-up is slow and, in some areas, almost impossible. Business can’t operate without power, even if somehow their business survived the storm(s). Many have not.
Florida’s prime industries are tourism, agriculture, aviation and aerospace, life sciences, and international trade. It was last estimated that tourism contributed some $58.5 billion to Florida’s GDP (2023). Major attractions are Disney World, Universal Studios, and the beaches. But severe damage to hotels and beaches, particularly along the Gulf of Mexico coast north and south of Tampa or from Fort Myers to Big Bend in particular, have suffered major damage. The roof of Tropicana Field, home to the Tampa Bay Rays baseball team was blown off. Home games of the Tampa Bay Lightning NHL hockey team have been cancelled.
Some places have been literally wiped off the map. But a reminder that Hurricane Milton left even Cape Canaveral as a Category 1 storm. The damage to the state’s agriculture industry could be substantial. Agriculture employs some two million people. Florida citrus-growing is major, supplying some 80% of U.S. oranges and fruits. Much of that is exported. Agriculture contributes some $104 billion to the Florida economy every year.
Aviation and aerospace contribute some $144 billion to the Florida economy. Florida ranks second in the U.S. for pharmaceutical and medical manufacturing. Florida is a major exporter, exporting over $60 billion of goods. It is the eighth largest exporter in the U.S. Climate change, natural disasters, and rising seawater is a threat to Florida’s economy, particularly tourism and agriculture. That in turn could impact the entire U.S. economy.
It's a double whammy. Two 1-in-100-year storms within two weeks (some even said 1-in-1,000-year storms). The cost to the Florida economy (and to a lesser extent North and South Carolina and Georgia) is immense. It translates into lost homes, lost businesses, lost jobs, lost lives, and more. The number of deaths alone is still being tallied. The damage and costs won’t be known for weeks, maybe months. Some have even speculated that parts of Florida will become uninhabitable. Many homes will be destroyed, or with the costs to repair them borne mostly by the homeowner—if they can afford it. That in turn could result in hundreds of homes just being abandoned. The state could depopulate as the costs to rebuild in a major hurricane zone are next to impossible.
It'll take some time for the costs of these storms to be tallied in terms of damage and deaths. This was the third hurricane to hit Florida in 2024. Then there were also the tornadoes. The hurricane season isn’t over yet. Could there yet be another one? The impact on GDP, employment, and more won’t become clear for weeks, maybe longer.
But—and here is the big but—will its impact be felt mostly by Florida and not the rest of the U.S.? Overall, its biggest impact will be on Florida, particularly its tourism and agriculture and to all the people who lost their homes and jobs. Rebuilding efforts will be slow and funding of it possibly even slower. Losses to agriculture could be felt with inflated prices on some foods such as oranges. But beyond that it is difficult to say. It will have no impact on Q3 GDP as Helena came at the end of it while Milton is in Q4. One of the areas hardest hit by Helena was in North Carolina in a lightly populated region.
Tampa is Florida’s largest port city but ranks only at #24 in the U.S. It’s important, yes, but a lot of its traffic can be diverted, even as there will be some supply disruption. The hurricanes missed the oil and gas facilities in the Gulf and the major refineries along the coast of the Gulf. Hurricane Katrina in 2006 did shave some 0.5–0.7% off of U.S. GDP. But its destruction did impact oil and gas and refineries. We expect this should be less. We won’t know until we get the first reading of Q4 GDP in January 2025. The hurricanes will have little impact on the world. Our conclusion is this is a black swan event for Florida, but beyond that not so much. It is not remotely on the scale of the global financial crisis of 2008 or even the pandemic of 2020. To be a serious black swan event, it should impact the world. This doesn’t.
Stagflation?
U.S. CPI Y-O-Y, Core CPI Y-O-Y, U.S. 10-Year Treasury Note
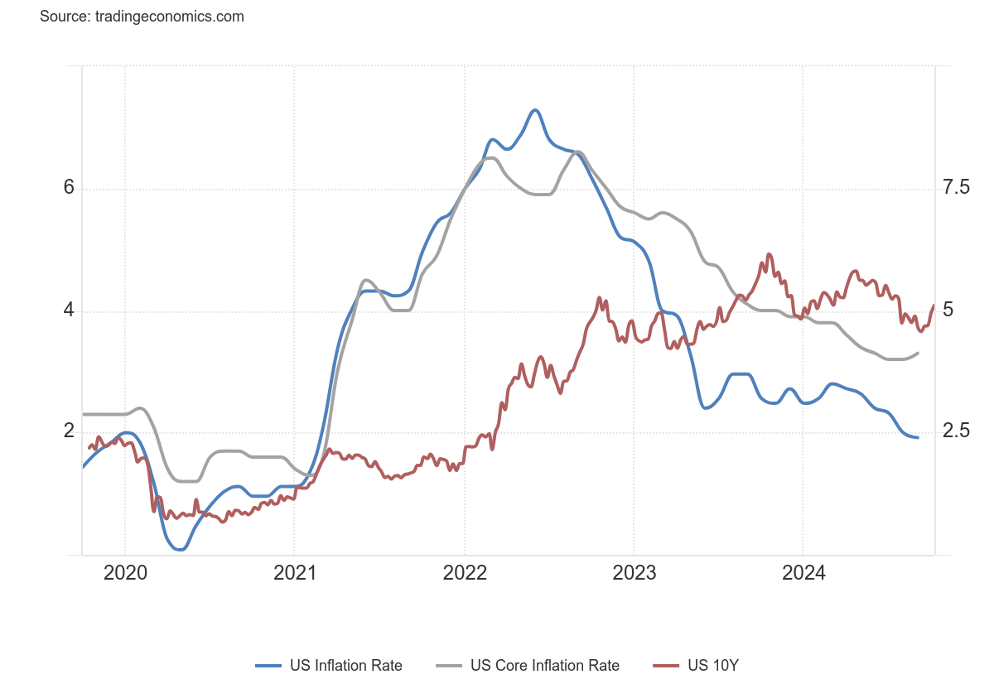
Source: www.tradingeconomics.com, www.bls.gov
The U.S. CPI came out this past week and the market was pleased that the September CPI was lower than that for August. The CPI came in at 2.4% year-over-year (y-o-y) but above the 2.3% consensus. The August CPI was 2.5% y-o-y. It was the lowest CPI since February 2021. But the core inflation rate (ex. food and energy) came in at 3.3%, above August’s 3.2% and above expectations of 3.2%. Finally, the PPI came in at 1.8% y-o-y, lower than the August PPI that was up 1.9% y-o-y. The expectation was a rise of only 1.5% y-o-y. The Fed pays more attention to the core CPI and the PCE inflation. All this has lowered expectations of a 50 bp Fed cut in November. 25 bp is now the wide consensus. Still, it was intriguing that the CPI went down but core CPI went up. Note that the 10-year U.S. treasury note remains above both the CPI and core CPI, last quoted at 4.10%. None of this takes into account potential inflation, resulting supply disruptions due to the hurricanes.
While inflation appears to be coming down, albeit slowly now, weekly jobless claims suddenly jumped. This past week weekly jobless claims rose to 258,000, well above the expected 230,000 and last week’s 225,000. Continuing jobless claims also rose to 1.86 thousand, up from 1.82 thousand. That’s the highest since July 2024. The initial jobless claims were the highest since June 2023.
U.S. Initial Jobless Claims and Continuing Jobless Claims
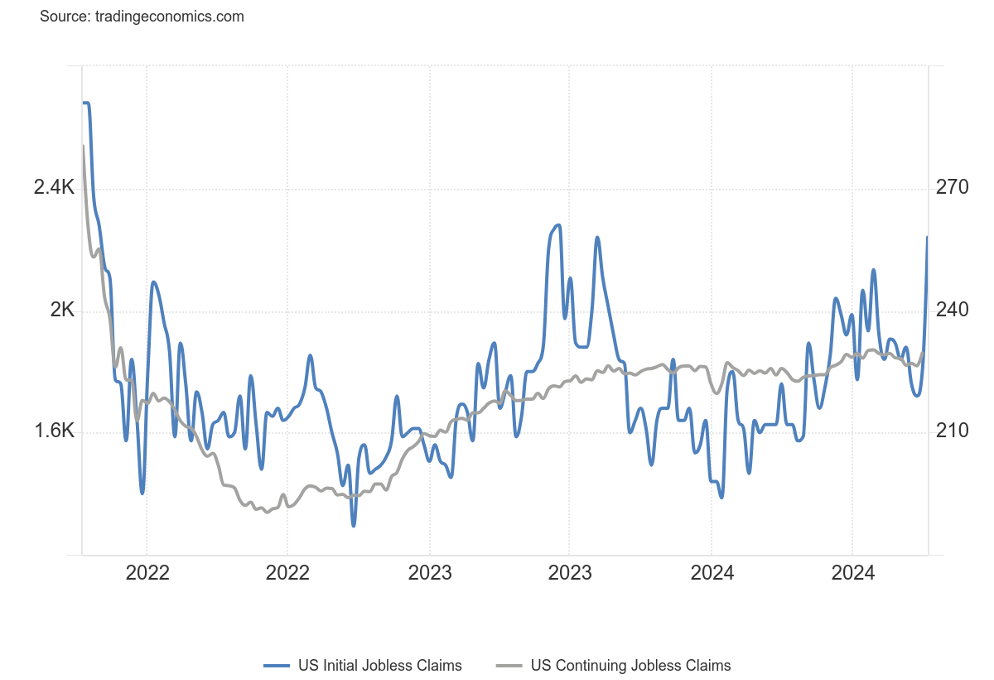
Source: www.tradingeconomics.com, www.dol.gov
While it is only a one-week snapshot and doesn’t contain any potential rise in jobless claims from the hurricanes, the higher than expected numbers were a surprise to many. With inflation possibly bottoming and unemployment rising, we could be in the early stages of stagflation; i.e. a weak economy with rising inflation. Something to note as we await the fallout from Hurricanes Helene and Milton.
Canada’s Job Numbers
Source: www.statcan.gc.ca
Canada unexpectedly added 46,700 jobs in September. Surprisingly, the market expected 35,000. In August, Canada added 22,100. The unemployment rate fell to 6.5% from 6.6% vs. the expected 6.7%. Talk about gangbusters. The odds are now favouring that the BofC will cut only 25 bp at their next meeting. Canada’s economy appears to be hot. But there were more surprises. The job gains were primarily full-time jobs that jumped 112,000 vs. a loss of 43,600 in August and expectations of only 45,000 new full-time jobs. Offsetting that was that part-time jobs fell 65,300 vs. a rise of 65,700 in August and expectations of another loss of 10,000 jobs. Many jobs were in information services, professional, scientific, and technical services. Jobs were primarily in the private sector as public sector jobs actually fell 24,000. Ontario and Quebec led the way.
Noteworthy, however, was that y-o-y part-time jobs have led the way. In September, youth in the 15–24-year age bracket had good gains as did women in the 25–54-year age bracket. The fall in the unemployment rate was helped by a fall in the labour force participation that dropped to 64.9% from 65.1% and expectations that it would be 65.3%. Slower labour force population growth also helped the drop in the unemployment rate.
Not surprisingly, 2-year bond yields rose as thoughts of BofC rate cuts eased. The good report also helped the Cdn$ (loonie) to rise. Not so good was wage growth, which slowed to 4.5% y-o-y, down from 4.9% and the expected gain of 4.8%. The BofC’s next interest rate decision is October 23.
Canada’s job reports can be volatile. The jobs in September could suddenly disappear in October. But, overall, job creation in 2024 is below 2023. By September 2023, Canada had reported the creation of 362,400 jobs vs. 257,500 so far in 2024. And the unemployment rate is up 1.6% from its low in July 2022. Many economists were surprised at the robust report. It was unexpected good news.
Chart of the week
The Buffett Indicator 1970–2024
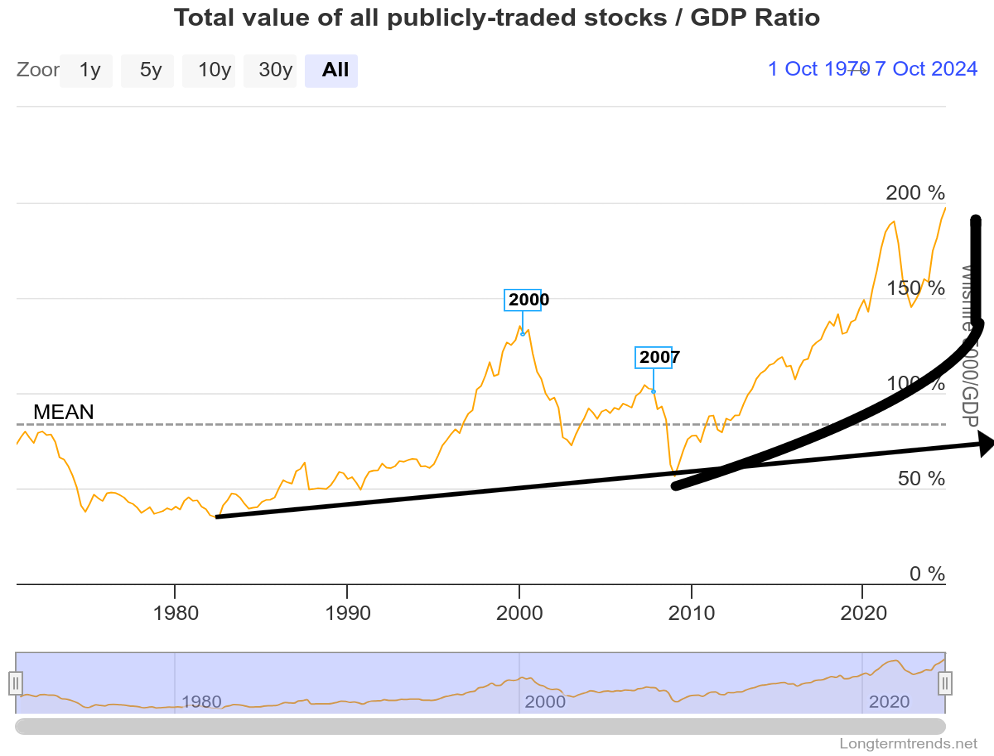
Source: www.longermtrends.net
The chart of the Buffett Indicator caught our attention because it is so stark. Never in the history of the indicator has it been at such lofty heights. That last peak came in 2021 before the 20%+ bear market of 2022. The S&P 500 fell over 25%. It was the worst bear market since the swift, sharp pandemic bear of 2020. However, it seems that screaming to new heights has had little or no impact on the market just yet.
So, what is the Buffett Indicator, aka Buffett Index or Buffett Ratio? Quite simply, it is the ratio of the total U.S. stock market to GDP. The proxy is the Wilshire 5000 Index. Buffett himself has termed the ratio as “probably” the best single measure of where valuations stand at any given time. Using the Wilshire 5000 Index does the job because the Wilshire is widely regarded as the definitive benchmark of the U.S. equity market.
What is disturbing is that the indicator has never been so high. Could it go even higher? Of course, it could. But a reminder that, at its peak in 2000, the S&P 500 then fell 49% from 2000–2002 and at a lower peak in 2007 the S&P 500 fell almost 57% from 2007–2009. There was also that peak back in 1972 that saw the S&P 500 fall 48% from 1973–1974. Shrugging it off is like shrugging off Hurricane Milton. As a broker back in the 2000s, we recommended raising cash positions in the early part of the year and into the summer. A few shrugged and refused. When the Lehman Brothers meltdown occurred in September/October 2008 their situation was, in the words of the Mayor of Tampa, “stay and you’re going to die”, referring to the fast-approaching Hurricane Milton. Or, in this case, your portfolio will be swept away.
Yet all we hear is that we are going to have a soft landing or even no landing at all. Current wars have had little impact on the markets as we moved higher and higher. Not even the threat of an Israeli retaliation against Iran’s oil or nuclear facilities has had a negative impact on the price of oil. Instead, markets move higher with the S&P 500 once again hitting new all-time highs. Admittedly, sharply rising oil prices today would have considerably less impact on markets than they did in the 1970s when the era of cheap oil came to an end. Today, it is just not the same factor in the economy that it was then. Hard to believe, but oil prices today are about the same level they were in the 1980s after the price of oil collapsed due to the end of the Iranian hostage crisis and Saudi Arabia pumping lots of oil. Today, WTI oil would have to rise over $175/barrel to equal what it was at its last major peak in 2008 and the peak in 1980 with the Iranian hostage crisis.
The Buffett Indicator is a warning. But how many will heed it?
Markets & Trends
|
|
|
|
% Gains (Losses) Trends |
|
||||
|
|
Close Dec 31/23 |
Close Oct 11, 2024 |
Week |
YTD |
Daily (Short Term) |
Weekly (Intermediate) |
Monthly (Long Term) |
|
|
Stock Market Indices |
|
|
|
|
|
|
|
|
|
S&P 500 |
4,769.83 |
5,815.03 (new highs)* |
1.1% |
21.9% |
up |
up |
up |
|
|
Dow Jones Industrials |
37,689.54 |
42,863.86 (new highs)* |
1.2% |
13.7% |
up |
up |
up |
|
|
Dow Jones Transport |
15,898.85 |
16,238.25 |
2.7% |
2.1% |
up |
up |
up |
|
|
NASDAQ |
15,011.35 |
18,342.94 |
0.1% |
20.8% |
up |
up |
up |
|
|
S&P/TSX Composite |
20,958.54 |
24,471.17 (new highs)* |
1.3% |
16.8% |
up |
up |
up |
|
|
S&P/TSX Venture (CDNX) |
552.90 |
605.43 |
1.7% |
9.5% |
up |
up |
down (weak) |
|
|
S&P 600 (small) |
1,318.26 |
1,412.05 |
0.3% |
7.1% |
up |
up |
up |
|
|
MSCI World |
2,260.96 |
2,442.05 |
flat |
8.0% |
neutral |
up |
up |
|
|
Bitcoin |
41,987.29 |
63,010.19 |
1.1% |
50.1% |
up (weak) |
up |
up |
|
|
|
|
|
|
|
|
|
|
|
|
Gold Mining Stock Indices |
|
|
|
|
|
|
|
|
|
Gold Bugs Index (HUI) |
243.31 |
319.23 |
1.0% |
31.2% |
up |
up |
up |
|
|
TSX Gold Index (TGD) |
284.56 |
376.71 |
2.7% |
32.4% |
up |
up |
up |
|
|
|
|
|
|
|
|
|
|
|
|
% |
|
|
|
|
|
|
|
|
|
U.S. 10-Year Treasury Bond yield |
3.87% |
4.10% |
3.0% |
5.9% |
|
|
|
|
|
Cdn. 10-Year Bond CGB yield |
3.11% |
3.24% |
0.6% |
4.2% |
|
|
|
|
|
Recession Watch Spreads |
|
|
|
|
|
|
|
|
|
U.S. 2-year 10-year Treasury spread |
(0.38)% |
0.14% |
250.0% |
136.8% |
|
|
|
|
|
Cdn 2-year 10-year CGB spread |
(0.78)% |
0.15% |
475.0% |
119.2% |
|
|
|
|
|
|
|
|
|
|
|
|
|
|
|
Currencies |
|
|
|
|
|
|
|
|
|
US$ Index |
101.03 |
102.91 |
0.4% |
1.9% |
up |
down (weak) |
neutral |
|
|
Canadian $ |
75.60 |
72.67 |
(1.3)% |
(3.9)% |
down |
down |
down |
|
|
Euro |
110.36 |
109.37 |
(0.4)% |
(0.9)% |
down |
up (weak) |
up (weak) |
|
|
Swiss Franc |
118.84 |
116.62 |
0.1% |
(1.9)% |
down |
up |
up |
|
|
British Pound |
127.31 |
130.67 |
(0.5)% |
2.6% |
down |
up |
up |
|
|
Japanese Yen |
70.91 |
67.04 |
(0.3)% |
(5.5)% |
down |
up (weak) |
down |
|
|
|
|
|
|
|
|
|
|
|
|
|
|
|
|
|
|
|
|
|
|
Precious Metals |
|
|
|
|
|
|
|
|
|
Gold |
2,071.80 |
2,676.30 |
0.3% |
29.2% |
up |
up |
up |
|
|
Silver |
24.09 |
31.75 |
(2.0)% |
31.8% |
up |
up |
up |
|
|
Platinum |
1,023.20 |
994.40 |
(0.7)% |
(2.8)% |
up |
up (weak) |
up (weak) |
|
|
|
|
|
|
|
|
|
|
|
|
Base Metals |
|
|
|
|
|
|
|
|
|
Palladium |
1,140.20 |
1,069.80 |
7.1% |
(6.2)% |
up |
up |
down |
|
|
Copper |
3.89 |
4.49 |
(1.8)% |
15.4% |
up |
up |
up |
|
|
|
|
|
|
|
|
|
|
|
|
Energy |
|
|
|
|
|
|
|
|
|
WTI Oil |
71.70 |
75.56 |
1.6% |
5.3% |
up |
down (weak) |
down |
|
|
Nat Gas |
2.56 |
2.63 |
(7.7)% |
2.7% |
up (weak) |
up |
down |
|
Source: www.stockcharts.com
Note: For an explanation of the trends, see the glossary at the end of this article.
New highs/lows refer to new 52-week highs/lows and, in some cases, all-time highs.
- * New All-Time Highs
Source: www.stockcharts.com
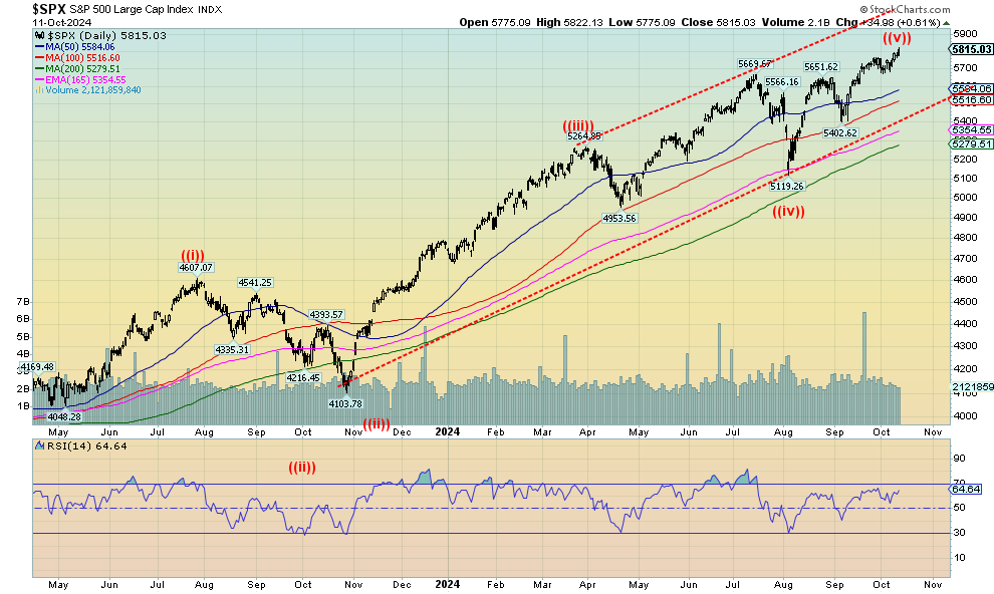
“I want to take you higher” appears to be the motto of the stock markets (with a shout-out to Sly and the Family Stone). Yes, the markets once again made all-time highs. Joining the all-time high party were the S&P 500 (SPX), the Dow Jones Industrials (DJI), the S&P 500 Equal Weight Index, the S&P 100 (OEX), the S&P 400 (Mid), the Wilshire 5000, the Russell 1000, and the Russell 3000. Here we are making new all-time highs, but note negative divergences setting in. The SPX RSI indicator is lower today than it was in June/July when the SPX was at lower prices. The negative divergences are showing up across all time frames—dailies, weeklies, and monthlies. It’s a warning. It doesn’t necessarily mean the markets will collapse tomorrow. These divergences were only visible on the dailies and weeklies before the pandemic crash in 2020. But they were visible across all time frames in October 2007 before the 2008 financial crisis. So, they should be heeded.
However, we won’t know that we have topped until we break down under first 5,700, then especially under 5,400. Under 5,100 it’s all over and a panic could follow. On the week, the SPX was up 1.1%, the DJI gained 1.2%, and the Dow Jones Transportations (DJT)was up 2.7% but still remains below its all-time highs, a divergence with the DJI. The NASDAQ was up 1.1% while the S&P 500 Equal Weight Index gained 0.8% and the NY FANG Index was up 2.2%. The S&P 400 (Mid) was up 1.1% while the S&P 600 (Small) gained 0.3%. Bitcoin gained 1.1% but is well below its all-time highs and keeps trading of late at either side of $60,000.
In Canada, the TSX Composite did make all-time highs, up 1.3% while the TSX Venture Exchange (CDNX) gained 1.7%. In the EU, the London FTSE fell 0.3%, the EuroNext was up 0.7%, the Paris CAC 40 up 0.5%, and the German DAX gained 1.3%. In Asia, China’s Shanghai Index (SSEC) finally realized its recent gains were too much too fast and fell 3.6%. The Tokyo Nikkei Dow (TKN) did gain 2.5%, but Hong Kong’s Hang Seng (HSI) fell 5.7%. Does more stimulus from China and PBOC re-ignite the SSEC? We’ll see this coming week. The MSCI World Index was flat on the week.
With so many negative divergences piling up, we know we are in the latter stages of this bubble rally. We just can’t tell where or when it will top. But we note the breakdown points that give us clues as to whether the market has topped or not. The pandemic high was in February 2020 and in March 2020 the market crashed. The 2007 market topped in October 2007, but the real crash and breakdown didn’t get under way until the summer of 2008, then crashed into September/October. The pandemic crash caught a lot of people by surprise, but the financial crisis crash had warning signs. We’re seeing the warning signs, but it doesn’t mean a crash could happen right away. However, it does suggest raising cash levels and moving to safety. Noteworthy is that when markets crash, it normally means everybody, including golds and energy. But in past crashes, golds have been the first out of the chute. Something to keep in mind.
Source: www.stockcharts.com
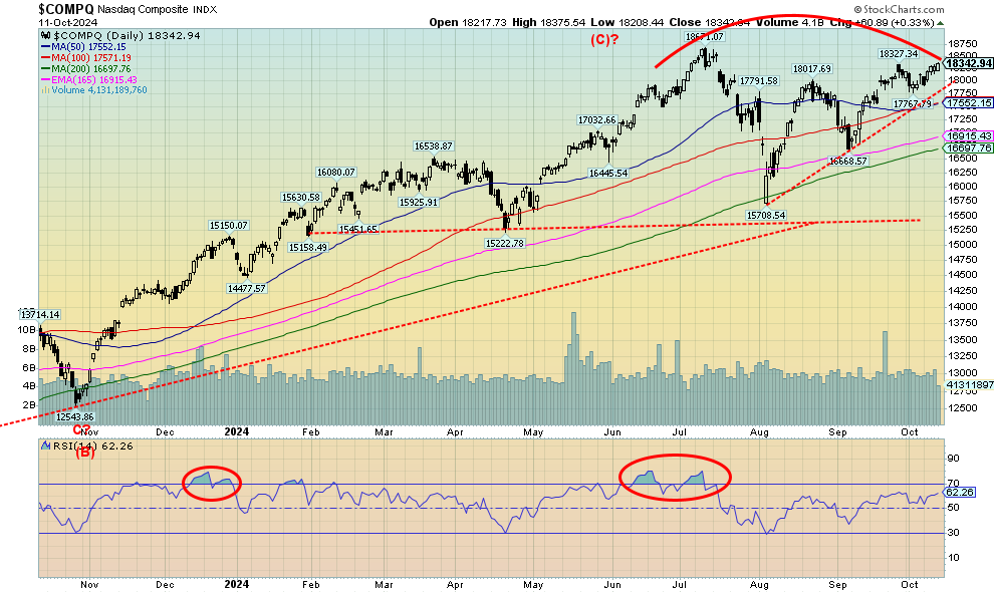
The NASDAQ did not join the all-time highs party this past week. That is a continuing divergence and should be heeded as a sign that all is not necessarily well. We continue to make what looks like a topping pattern, but we do acknowledge if the current market continues higher, yes, the NASDAQ could make all-time highs again. A break back under 17,750 might signal a top is in, but we’d feel better with a breakdown under 16,650. Under 15,700, it’s all over and a panic could occur. Resistance is the high at 18,671. If 18,671 was the top we note that the decline of 15.8% into August may have been the start of a larger decline. If that’s correct, then the current up wave is a correction to that decline. But even a corrective wave of this nature could make new highs. Hence, it’s best to heed breakdown points.
Source: www.stockcharts.com
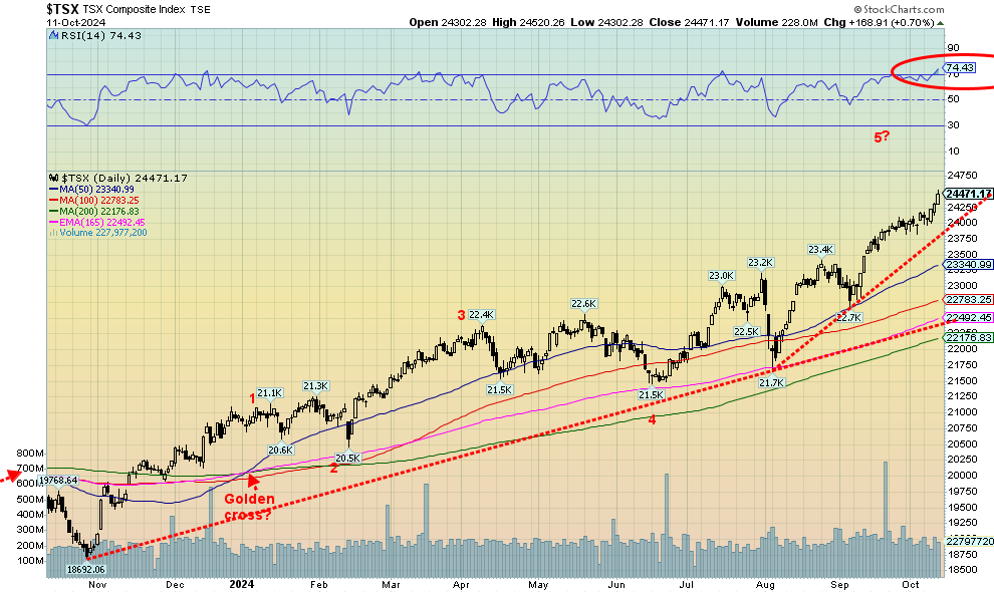
Once again, the TSX Composite made all-time highs. It’s become a habit. The TSX 60 also made new all-time highs as did the Consumer Discretionary (TCD), Financials (TFS), and Information Technology (TKK). Five out of the 14 sub-indices were down on the week led by Income Trusts (TCM), down 1.8% thanks to rising bond yields. Leading the way to the upside was Information Technology (TKK) +2.9%, followed by Industrials (TIN) +2.8%, and Golds (TGD) +2.7%. The TSX has become overbought with an RSI now at 74.4. But we always note that overbought can stay around longer than the shorts can stay solvent. Yes, we are beginning to spike and that is usually not a good sign. Extreme caution buying up here. The best performing sub-indices have been Golds (TGD) +32.4% and Materials (TMT) +28.1%. The only losing sector has been Telecommunications (TTS) -5.4%. Support appears to be down to 24,000, but below that level we could fall faster. Major support is down at 22,000–23,000. The two largest sectors are Financials (TFS) and Energy (TEN). They are up in 2024 at 18.9% and 20.0% respectively. With the market still rising and making all-time highs, we can’t say where we will top. We just note the breakdown points.
U.S. 10-year Treasury Note, Canada 10-year Bond CGB
Source: www.tradingeconomics.com, www.home.treasury.gov, www.bankofcanada.ca
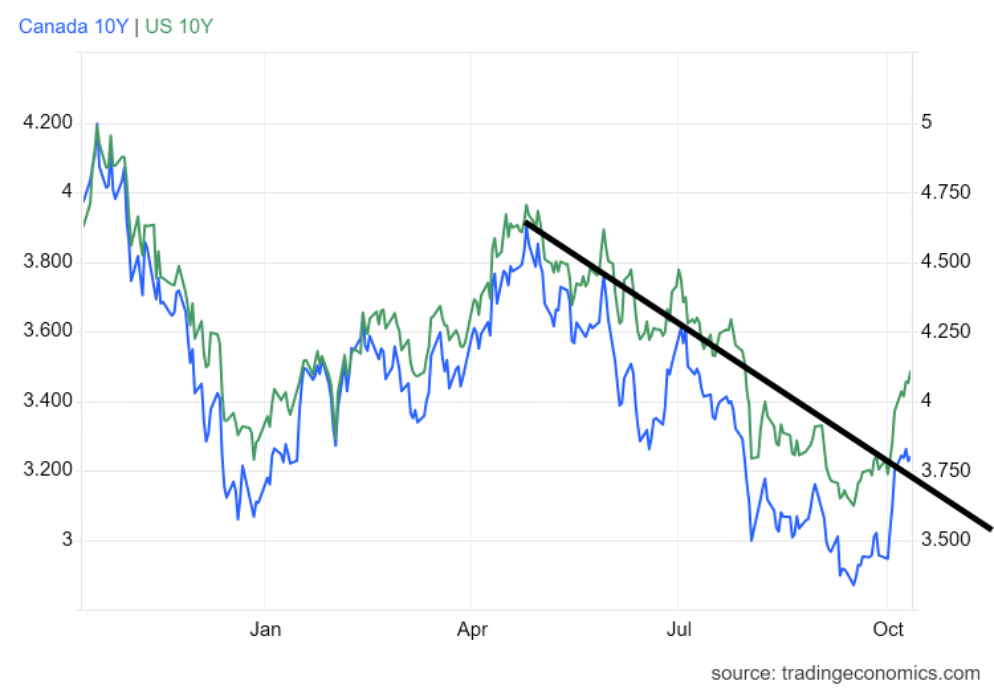
Friendly inflation numbers (CPI, PPI) keep alive thoughts of at least a 25 bp rate cut in November, even as some still expect at 50 bp cut. We’re with the former. But the bond market is showing doubts as the 10-year U.S. treasury note rose again this past week to over 4%, closing at 4.10%, up from 3.98% the previous week. The Government of Canada 10-year bond (CGB) also rose but less, up to 3.24% from 3.22%. Both yields are now above the rate of inflation in the U.S. and Canada, giving rise to a positive yield curve. The 2–10 spreads also rose this past week, becoming more positive and leaving inversion behind. The U.S. 2–10 spread is now at +14 bp while Canada’s 2–10 spread is now at +15 bp. Following a long period of an inverted yield curve, the change to a normal yield curve is usually a signal that we are getting closer to a recession. We say that despite many saying there will be no recession and, as a worst case, a soft landing. We can recall back in the late 70s–early 80s high inflation being cut down with high interest rates sparking a mild recession in 1980. But that recession was barely over when a much steeper, hard-landing recession got underway in 1981 to 1982. At the time, it was the steepest recession since the Great Depression. Could we follow a similar pattern of a soft landing followed by a hard landing?
Certainly, mixed reports on the state of the U.S. economy are giving rise to the up move in yields. Some Fed governors have mused about no rate cuts in November. There are not a lot of big numbers this coming week. Most notable are retail sales for September, the Philly Fed report, and housing starts. Canada gets the inflation numbers. The Canadian bond market is closed Monday for Thanksgiving and the U.S. bond market will be quiet for Columbus Day. There are no numbers being released Monday.
Probably the biggest concern for bonds going forward is the monstrous U.S. debt. Foreigners, particularly China and Japan, have slowed their purchases. China is a net seller, not a buyer. Others have picked up some supply but even that is slow. Much goes to intragovernmental agencies such as Social Security, plus some pickup from insurance companies, etc. Some fund managers have cut their purchases of longer-dated U.S. treasuries because of the uncertainty surrounding the U.S. election. Buying is better in the 1–5-year part of the curve. Many are also in the no landing to soft landing camp and as a result don’t see as much downside any longer for yields.
Source: www.stockcharts.com
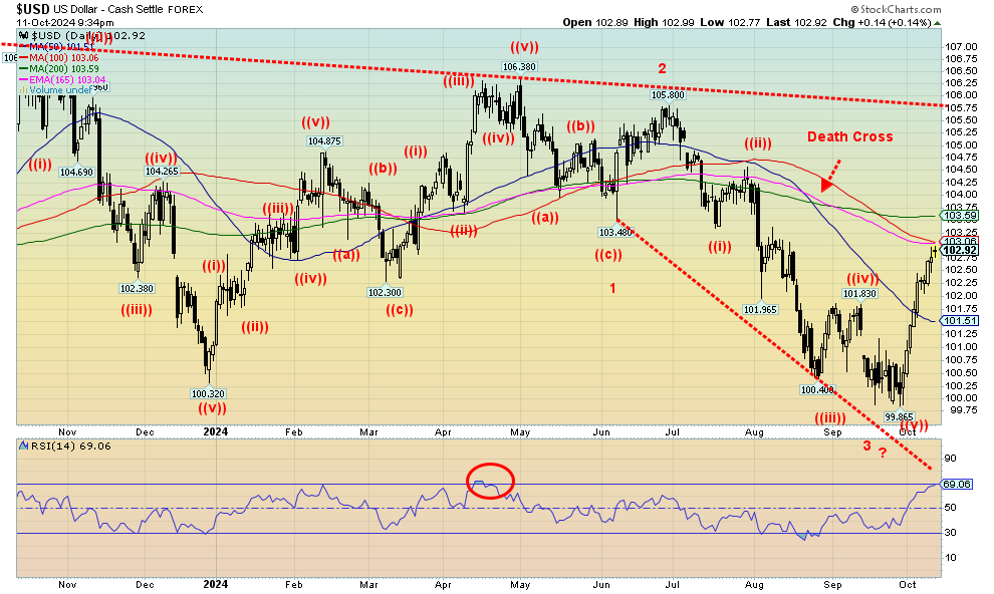
Geopolitical tensions have a way of rushing to U.S. dollars for safety. They go to gold as well. The US$ Index (USDX) continued its recent rise, up 0.4% this past week. The US$ Index is now up almost 3.1% from the September low. But its rise has been straight up with no pullback. Moves like that are normally not sustainable. We are running into a band of resistance from 103 to 103.60. While some indicators did give buy signals, we do not as yet have a major buy signal for the USDX. With USDX, other currencies fell. The euro was down 0.4%, the Swiss franc eked out a 0.1% gain, the pound sterling fell 0.5% while the Japanese yen dropped 0.3%. The Cdn$ didn’t survive the onslaught and fell 1.3%. The Cdn$ hasn’t fared well in 2024 and is in a down mode on all three fronts—short term, intermediate term, and long term; i.e. on the dailies, weeklies, and monthlies. The Cdn$ is down 3.9% in 2024, the weakest except for the Japanese yen.
Caution on the US$ Index as we run into a band of resistance. The RSI is also poised to move into overbought territory over 70.
Source: www.stockcharts.com
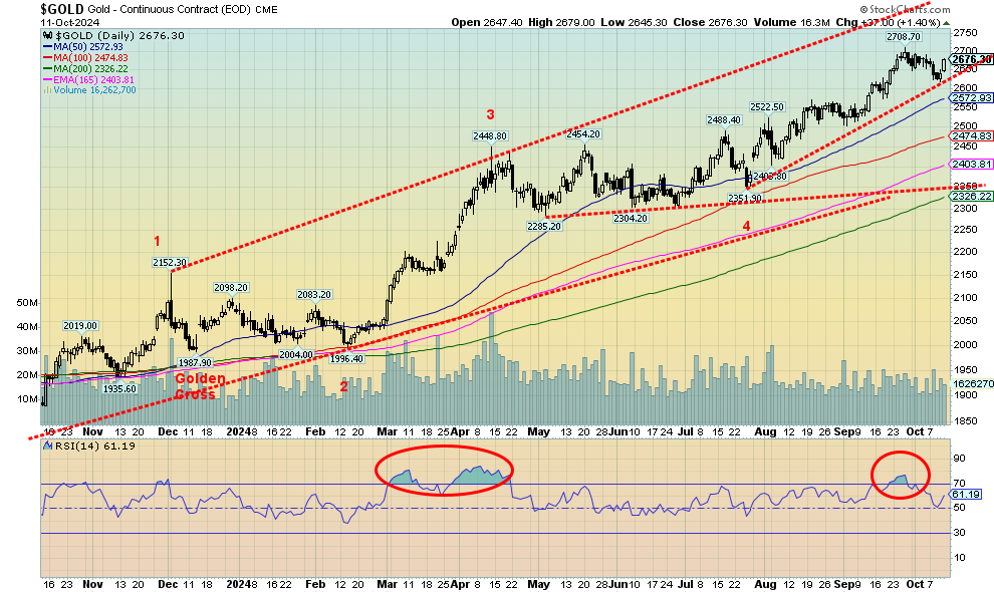
Despite signs that the U.S. economy is still strong and the US$ Index has been rising, gold battled against the headwinds and eked out an 0.3% gain this past week. An earlier pullback had taken us down to an uptrend line and it held. Silver didn’t fare as well and fell about 2.0%. Platinum continues to struggle, losing 0.7%. Of the near precious metals, palladium showed some life, rising 7.1%, but copper fell 1.8%. The gold stocks were positive with the Gold Bugs Index (HUI) up about 1.0% while the TSX Gold Index (TGD) rose 2.7%.
We’d be more excited about gold’s rise this past week if silver, platinum, and copper were also up on the week. You want to see all metals rising in tandem, not some up and some down. It suggests to us that the recent mild weakness for gold could still prevail for a bit longer. October is known as a weak month and, so far, we can’t say we’re wrong. Catalysts for gold to rise further include an escalation of the war in the Middle East, given Israel’s threat to retaliate against Iran or even a shift in the war between Russia/Ukraine if Ukraine were to actually use the long-range missiles to attack Moscow itself. The other wild card is the deeply divisive election in the U.S. that could still turn violent. Concern over the U.S. debt (the highest in the world) appears to have slipped back.
Friendly inflation numbers (CPI, PPI) this past week helped gold rebound from the mild sell-off. It kept hopes alive that the Fed might still cut 50 bp in November. 25 bp remains the overwhelming consensus. Another 25 bp would come at the December meeting. With the U.S. economy showing some signs of slowing, coupled with the mild rise in the CPI, some are now concerned about stagflation setting in. That would also be friendly for gold. So, the big three concerns that could spark higher gold prices are geopolitical tensions, domestic political tensions, and the potential for stagflation.
$2,700 remains resistance while $2,600 is support. Under $2,550 we could fall further; however, our expectations are that $2,600 would hold. Any upping of geopolitical tensions or domestic political tensions would spark gold higher. We consider gold rising in the face of a rising US$ Index positive and bullish for the longer term. There is considerable room for gold to rise towards $2,800 in the bull channel. The RSI, after being in the overbought zone for a short period, has room to move higher. For the past number of months, the RSI 50 has generally been support. And, so far, it continues to be that.
Source: www.stockcharts.com
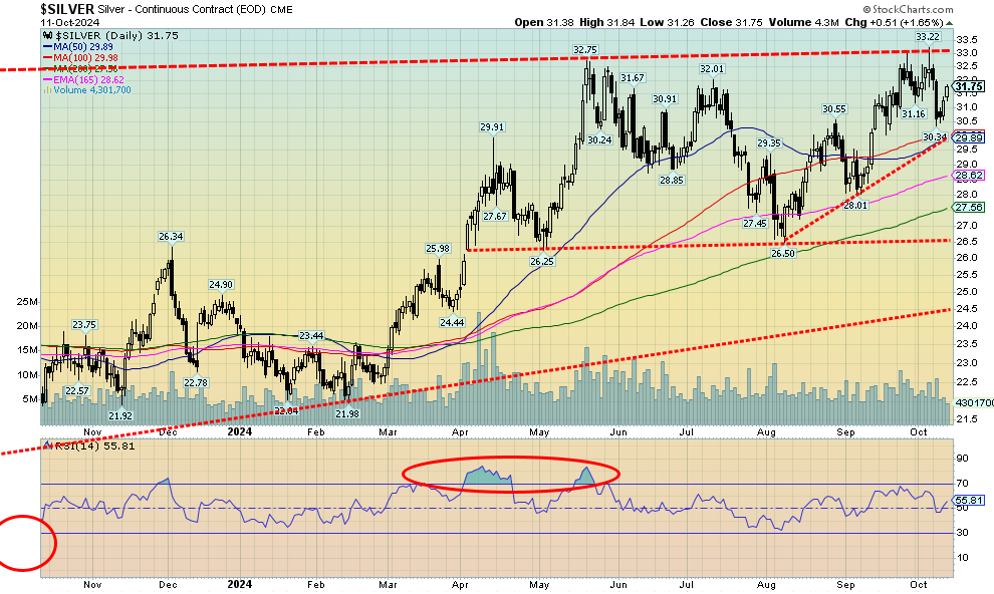
Silver can’t seem to get out of the way of itself. For almost six months now, we have been in what appears to be a large sideways pattern. The foray down to $26.50 occurred in August two months ago. We do have the appearance of what might be an awkward reverse head and shoulders pattern. If that’s correct, then once silver (finally) breaks above $33, our targets could be up to $39/$40, targets we have had for some time. All that is premised on any pullback holding above $30. If $30 broke, we could negate the pattern and fall to $27/$28. Silver actually fell about 2% this past week, despite gold gaining a small 0.3%. Both gold and silver stocks responded positively and, as we note next, rose on the week. We have noted before that silver broke out of what appears as a large cup and saucer pattern. The target for that pattern was also up to at least $39/$40.
Optimists are touting that silver could eventually see new all-time highs over $50. We are in agreement, but first we need to break above $33. We await.
Source: www.stockcharts.com
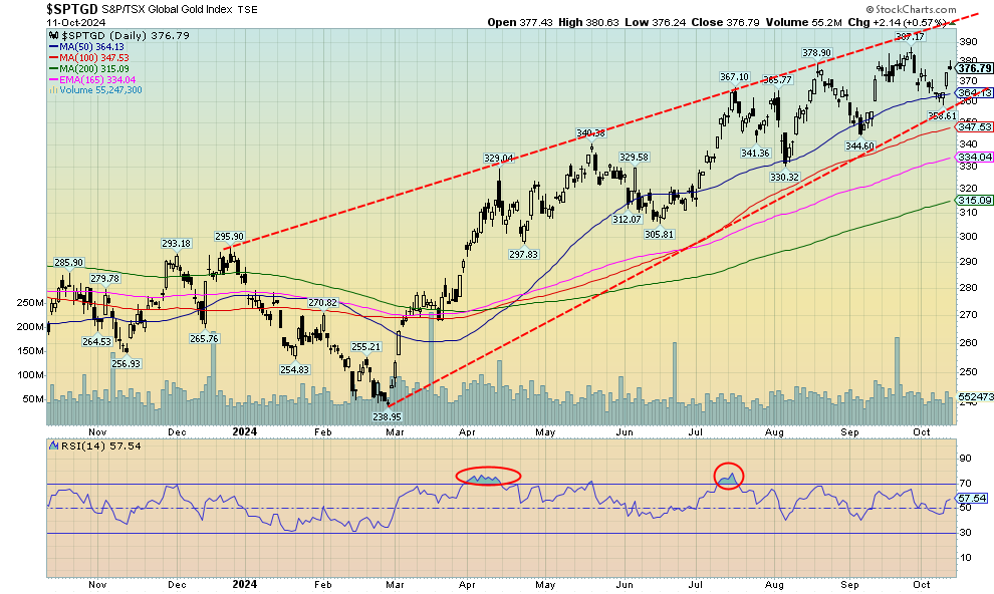
With gold higher, even as silver was lower, the gold stocks responded positively this past week. The TSX Gold Index rose 2.7% but the Gold Bugs Index (HUI) was up only 1%. Both indices are up over 30% thus far in 2024, one of the best-performing sectors. It’s been a steady climb for the TGD since that low seen last February. What is really positive about the climb is that it has been very choppy with constant pullbacks. To us, that indicates strength and we should continue to plow higher. The top of the bull channel is up around 400. A break under 360 would not be positive. But there is good support down to 330/345. Our trend is up and we appear poised to go higher—but it will be choppy.
Source: www.stockcharts.com
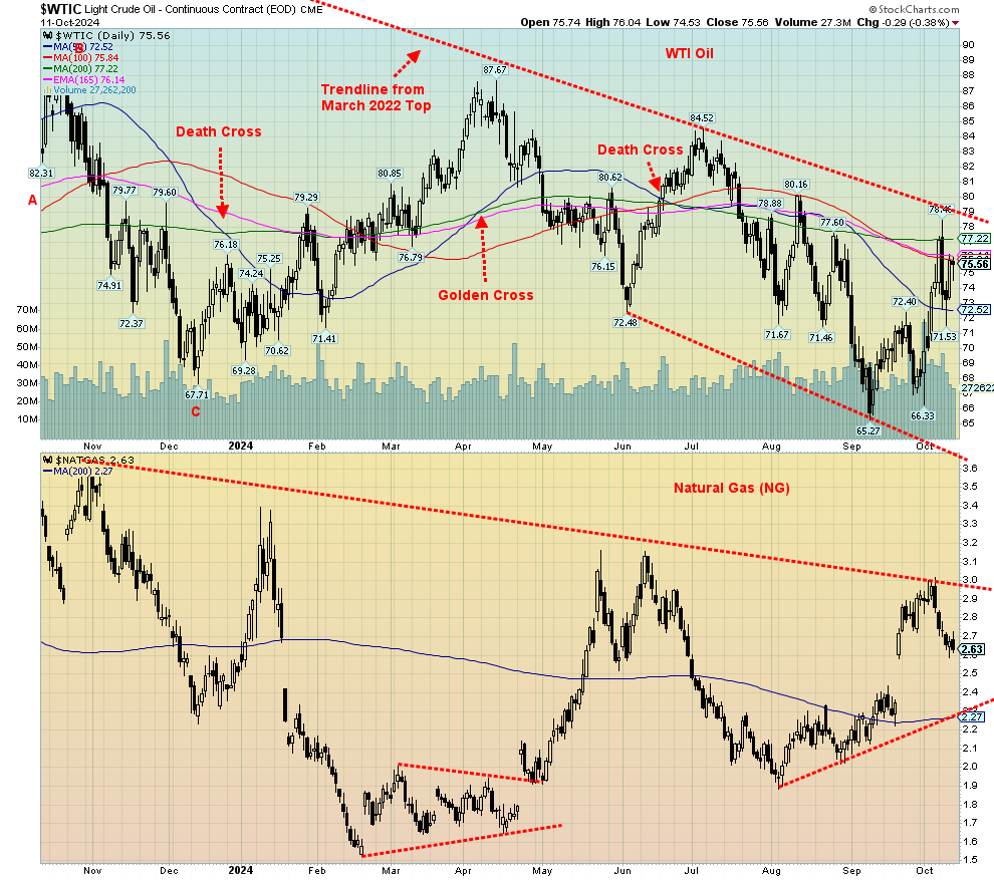
The big question for the oil and gas market is, what is Israel going to do vis-à-vis Iran? Bomb the oil facilities? Bomb the nuclear facilities? Do something else all together, or do nothing at all? Until something happens or we get closer to something happening, oil prices are probably going to wobble. While less of a concern, oil demand in Florida could actually drop due to the disruption from the hurricanes.
Initially, oil prices jumped when Iran lobbed dozens of missiles at Israel. But the lack of a follow-through yet on Israel’s part has left the market uncertain. The U.S. has asked Israel not to bomb the oil facilities or the nuclear facilities. Gulf states that produce oil have also asked Israel not to strike the oil facilities. While upwards of 30% of the world’s oil goes through the Straits of Hormuz, some other countries that have room could up their production. We await.
On the week, WTI oil was up 1.6% while Brent crude gained 1%. Natural gas (NG) at the Henry Hub fell 7.7% while NG at the EU Dutch Hub was down 2.5%. In the EU, prices fell because of increased wind production and good supplies, including more from LNG imports. NG at the Henry Hub fell because of supply disruptions and decreased demand due to the hurricanes. Some companies cut back because of the price drop. As for the energy stocks, the ARCA Oil & Gas Index (XOI) fell 1.0% but Canada’s TSX Energy Index (TEN) rose 2.3%. WTI oil could see some firmness because U.S. stocks are quite low and need refilling.
WTI oil still needs to get over $80 to suggest to us we are headed higher. NG needs to get over $3. Oil could break down under $72 while NG breaks under $2.40, and especially under $2.25. At this time, we don’t see either scenario unfolding to the downside. But upside breakouts are needed to convince us we are headed higher. Bombing Iran’s oil facilities would do that as in turn it threatens oil through the Straits of Hormuz, regardless of whether the U.S. warships are placed there.
Copyright David Chapman 2024
GLOSSARY
Trends
Daily – Short-term trend (For swing traders)
Weekly – Intermediate-term trend (For long-term trend followers)
Monthly – Long-term secular trend (For long-term trend followers)
Up – The trend is up.
Down – The trend is down
Neutral – Indicators are mostly neutral. A trend change might be in the offing.
Weak – The trend is still up or down but it is weakening. It is also a sign that the trend might change.
Topping – Indicators are suggesting that while the trend remains up there are considerable signs that suggest that the market is topping.
Bottoming – Indicators are suggesting that while the trend is down there are considerable signs that suggest that the market is bottoming.
Disclaimer
David Chapman is not a registered advisory service and is not an exempt market dealer (EMD) nor a licensed financial advisor. He does not and cannot give individualised market advice. David Chapman has worked in the financial industry for over 40 years including large financial corporations, banks, and investment dealers. The information in this newsletter is intended only for informational and educational purposes. It should not be construed as an offer, a solicitation of an offer or sale of any security. Every effort is made to provide accurate and complete information. However, we cannot guarantee that there will be no errors. We make no claims, promises or guarantees about the accuracy, completeness, or adequacy of the contents of this commentary and expressly disclaim liability for errors and omissions in the contents of this commentary. David Chapman will always use his best efforts to ensure the accuracy and timeliness of all information. The reader assumes all risk when trading in securities and David Chapman advises consulting a licensed professional financial advisor or portfolio manager such as Enriched Investing Incorporated before proceeding with any trade or idea presented in this newsletter. David Chapman may own shares in companies mentioned in this newsletter. Before making an investment, prospective investors should review each security’s offering documents which summarize the objectives, fees, expenses and associated risks. David Chapman shares his ideas and opinions for informational and educational purposes only and expects the reader to perform due diligence before considering a position in any security. That includes consulting with your own licensed professional financial advisor such as Enriched Investing Incorporated. Performance is not guaranteed, values change frequently, and past performance may not be repeated.
About the author


Website: https://www.enrichedinvesting.com
Disclaimer: David Chapman is not a registered advisory service and is not an exempt market dealer (EMD) nor a licensed financial advisor. We do not and cannot give individualised market advice. David Chapman has worked in the financial industry for over 40 years including large financial corporations, banks, and investment dealers. The information in this newsletter is intended only for informational and educational purposes. It should not be considered a solicitation of an offer or sale of any security. The reader assumes all risk when trading in securities and David Chapman advises consulting a licensed professional financial advisor before proceeding with any trade or idea presented in this newsletter. David Chapman may own shares in companies mentioned in this newsletter. We share our ideas and opinions for informational and educational purposes only and expect the reader to perform due diligence before considering a position in any security. That includes consulting with your own licensed professional financial advisor.