- As Ukraine’s Zelenskyy suggests his government could finally forsake NATO and embrace neutrality, should gold bugs be concerned about a sinking price of gold?
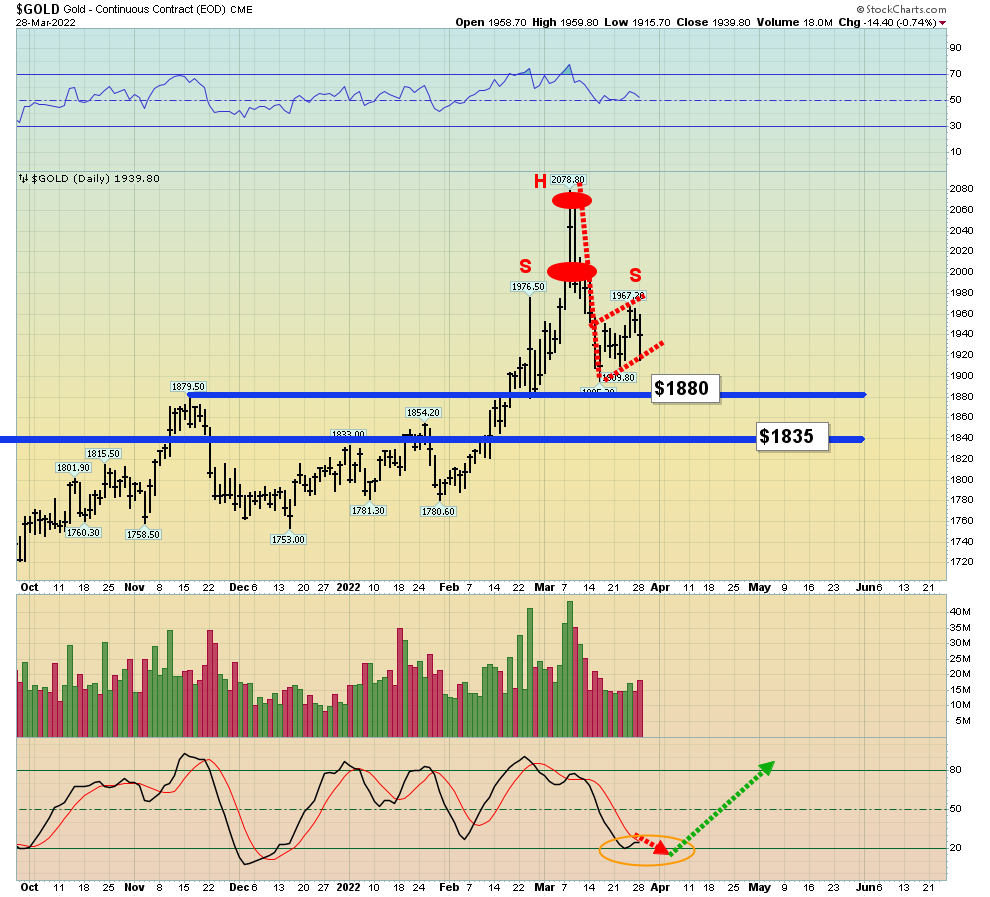
 Click to enlarge this daily gold chart. From a technical perspective, there’s a nasty H&S top pattern in play. The downside price implications could cause some panic amongst unprepared investors.
- The right shoulder may also be morphing into a loose bear flag. Stochastics is almost oversold, but not quite there.
- The good news is that many gold bugs sold some miners into my $2000-$2089 sell zone and have a nice pile of dry fiat powder ready to deploy.
- I have suggested using the important $1880 and $1835 support zones for fresh buys.
- There’s no guarantee that gold does decline to these buying areas, but investors should be ready for action if it does!
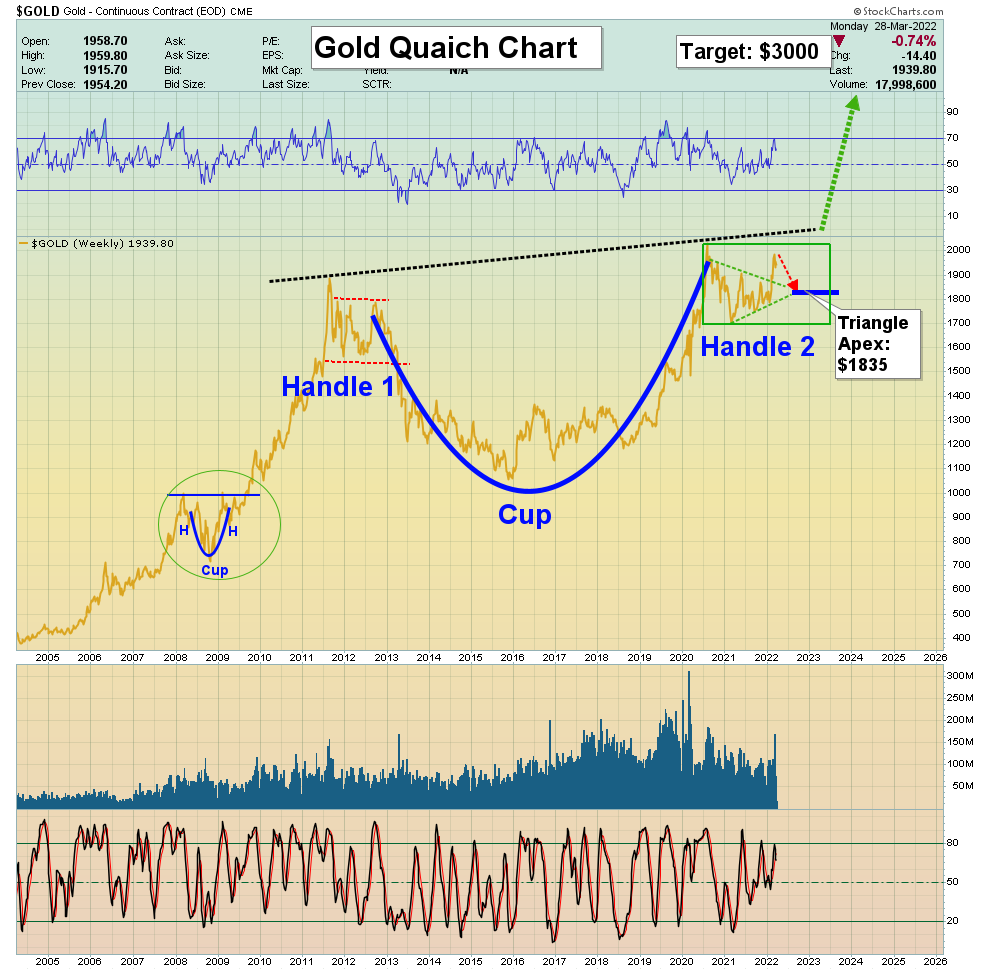
 Click to enlarge this fabulous long-term chart for gold.
- The quaich pattern of 2008-2009 looks like a tiny ant compared to the current one that is poised to launch a Chindia-oriented “gold bull era”… an era that should last for about 200 years.
- In the short-term, “risk on” is the theme likely to prevail. Tactics for investors? Well, please click here now. While the massively overvalued US stock market offers some short-term trading opportunities, serious investors risk being literally annihilated as the CAPE ratio reverts to more normal levels of 20, 15, with a possible overshoot to 10 or 5.
- Please click here now. Double-click to enlarge this enticing bitcoin chart. A base pattern and upside breakout are in play. A final dip to $25,000 or $20,000 is possible, but this is a decent area for new investors to put a toe in the crypto asset class waters.
- At my crypto palace newsletter, our current focus is buying coins issued by the big exchanges, like Kucoin and FTX. At $499/year the newsletter is outstanding value, and I have a special offer this week of just $259 for 15 full months of crypto market action! Send me an email if you want the offer. Thanks!
- Bitcoin can never replace gold and should not be compared to gold, but profits made with it can (and should) be used… to buy more gold. Anyone who stares at a glistening 24 carat gold bar or coin in their hand almost always wants more!
- What about the big global picture? Well, of course that’s all about gold and the ongoing demise of fiat. While the Ukraine war may have peaked as the main driver of short-term price action, please click here now. Tension between US republicans (aka the red hats) and democrats (aka the blues) is intense and the nation now moves towards mid-term elections.
- For America, the 2021-2025 war cycle is both civil and global.
- Horrifically, the nation’s two main political parties are both fiat-obsessed while most of the problems that average citizens face were created by using fiat for the nation’s currency.
- As the two parties try to fix what fiat ruined with more fiat schemes, the rise of significant violence that morphs into civil war is a real risk that wise gold bugs need to consider.
- Please click here now. Double-click to enlarge this snapshot of some key grain price charts.
- To deal with the skyrocketing prices, the nation’s policy and law makers tell the average person to make significant sacrifices in terms of basic food, shelter, and transport necessities, while they themselves live like overfed hogs gorging at a royal trough.
- This can’t end well.
- What is the trigger for the beginning of basic necessity riots that morph into civil war in America?
- For the likely answer to this horrifying question, please click here now. Double-click to enlarge. Note the blue line that I’ve added to the grain chart now. The likely answer that another leg higher (above the blue lines on the charts) in food prices would be one main catalyst for the start of significant US street riots.
- To view another, please click here now. Double-click to enlarge this important oil chart. There was a brief overshoot through the huge $114 resistance zone to $130, and the rally has stalled… but only temporarily.
- Please click here now. Double-click to enlarge this quarterly bars chart for oil. A huge bull flag/drifting rectangle is in play, with a rough target of $250/bbl. The deeper the current pullback becomes, the stronger the pattern becomes.
- The miners? Well, please click here now. Double-click to enlarge this GOAU ETF chart. Watch the uptrend line. A break of that is likely to usher in a deeper correction as gold potentially reaches $1880 or $1835. Investors need to be serious buyers of serious miners if we get that pullback, with an eye on record highs to follow!
Thanks!
Cheers
St

