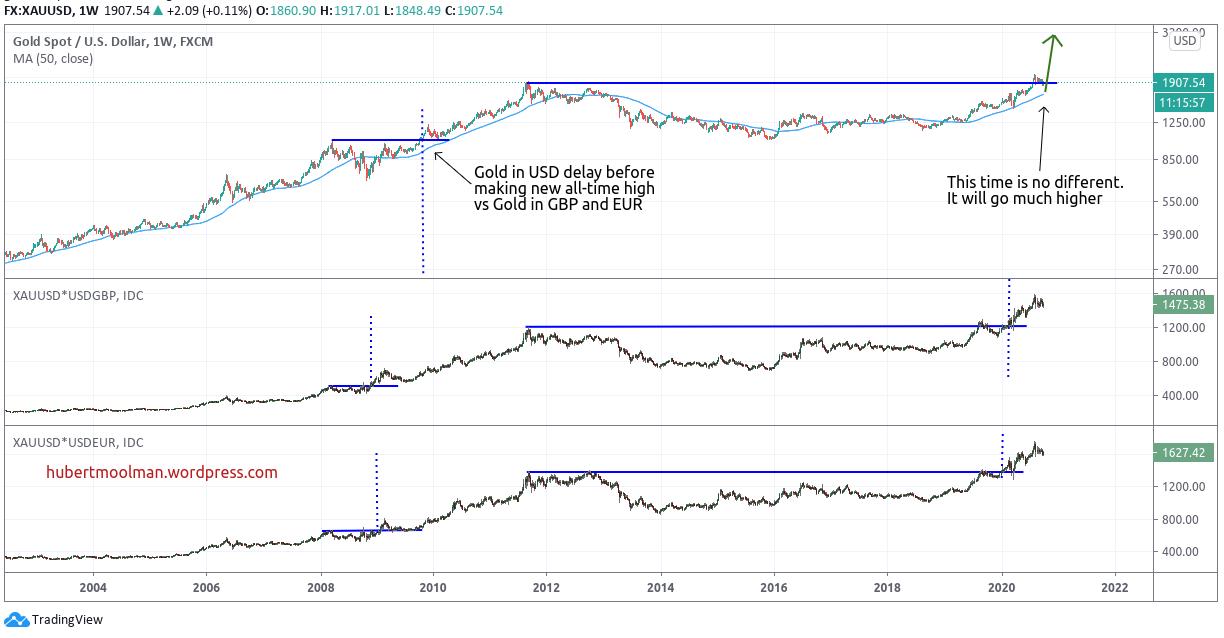
Gold is trading really close to its 2011 all-time high. This is obviously a critical level for the future of gold prices.
Historically gold in US dollars often clears significant all-time highs only some time after significant currencies like the Euro and British pound.
This is mainly due to US dollar behaviour during times of significant risk aversion, like we’ve had this year and 2008, for example.
The following charts comparing gold in USD, in GBP and in Euro shows just that:

Gold in USD only surpassed its significant March 2008 high about a year after gold in GBP and Euro did it. We have a similar setup where gold in GBP and Euro already hit their 2012 high around August 2019.
Both GBP gold and Euro gold are sitting comfortably above their 2012 high. History strongly suggests that USD gold will follow and get comfortably above the 2012 high real soon.
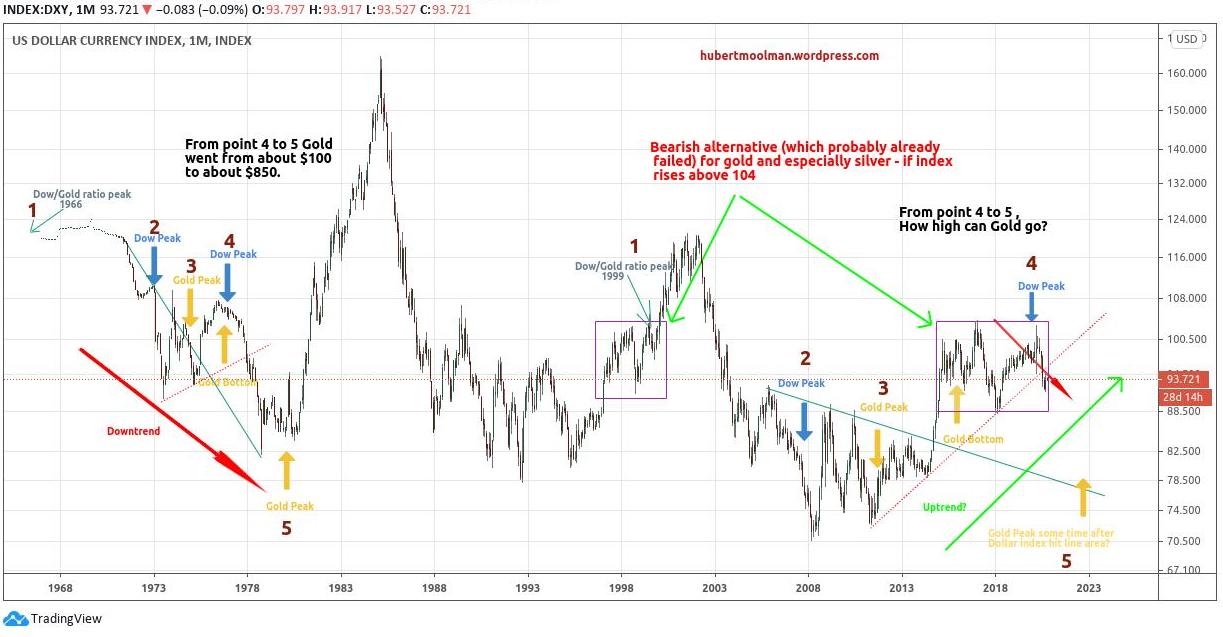
The US dollar cycle has turned and is likely to be under severe pressure over the coming months. This will significantly support USD gold prices.
The following chart (with analysis here) shows the US Dollar Index from a long-term point of view:

This suggest that we are in a part of the US dollar cycle between points 4 and 5, which is similar to the late 70s. Gold is likely to emulate the late 70s performance where it went from about $100 to $850 on the back of US dollar decline.
For more on this and this kind of fractal analysis, you are welcome to subscribe to my premium service. I have also recently completed a Silver Fractal Analysis Report as well as a Gold Fractal Analysis Report.

