But first, 'tis been ages since we've opened with a quick quiz, so here we go:
■ By the Dollar Index (which is all the rave) having settled out its week yesterday (Friday) at 112.820, how far is that below the all-time high? Answer: -32%.
■ Since 1980, the population of the U.S. has risen +49%; by how much for the same period has its money supply ("M2" basis) risen? Answer: +1,252%.
■ Can the entirety of "M2" cover the market capitalization of the S&P 500, (which at 3693 is now -22.5% year-to-date)? Answer: No. Extra Credit: how much need be "created" to so do? Answer: $11 Trillion.
■ Upon the S&P 500's pre-DotComBomb/FinCrisis top in 2000 (given that "What, me worry? It always comes all the way back..."), how long did it take for the S&P to trade just 2% higher? Answer: 13 years.
■ "Got Gold?" Answer, (if a valued reader): Yes. (Otherwise, not yet).
Oooh, and speaking of the S&P, recall our penning this past 21 May that we already were "...in anticipation of it dropping lower still to the top of the 3600-3200 support zone..."? Now four months hence, Goldman Sachs just figured that out yesterday. Impressive research over there by you Battery Park City folks. Or as dear old Dad would've queried: "What else ya got?"
As for the wee world of Gold, even as the wheels are collectively coming off everything else in The Investing Age of Stoopid, price put in yet another fairly subdued week. (Yawn pause...) 'Tis becoming quite impossible to imagine Gold being this inert. As we wrote to a fine friend and colleague last Monday with respect to falling asset prices: "It just does not look good going forward as this massive monetary inflexion point runs its course, (i.e. the overvaluation bubble of everything finally blows)." And yet. Gold continues to snooze with a downside bias.
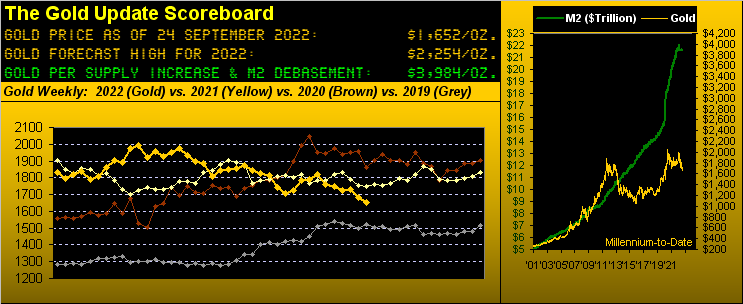
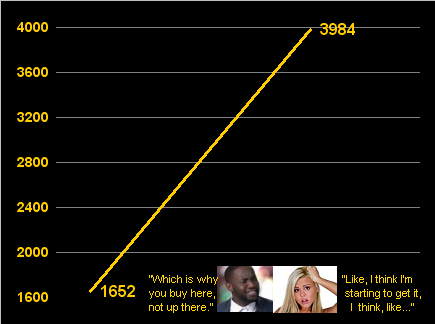
'Course, by valuation, Gold is on a higher plane than "everything" despite its price being deep in the dumpster. By our opening Scoreboard, we today value Gold at 3984; yet it settled the week at 1652. Per points range, 'twas Gold's 13th-narrowest week of the 39 year-to-date, with another new low (1647) having traded in the balance. Here are Gold's weekly bars, now two weeks into the fresh parabolic red-dotted Short trend. Indeed, Mr. Shawn, "It's a Mad, Mad, Mad, Mad World" --[Casey/U.A., '63]:
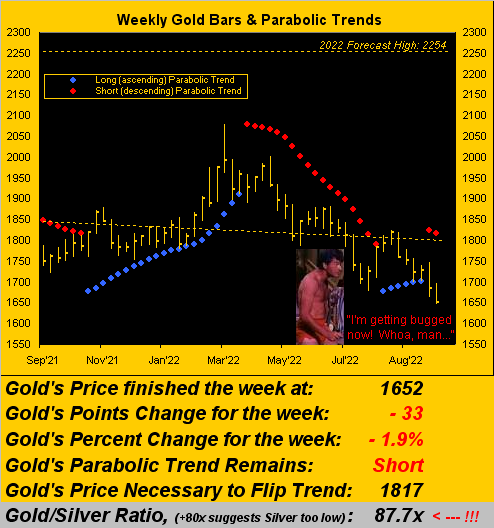
Obviously, as detailed a week ago -- although Gold's fundamental valuation is nearly 4000 -- its technical bent is down, and notably so after having broken the key 1678 level which you'' recall after twice tested couldn't survive thrice. To review, this new Short trend by historical track "ought" see Gold tap the 1599-1585 area, bearing in mind that 1578 is the centerpiece of a much broader 1704-1451 underlying price structure, (and 'tis in the technical vacuum that "centerpieces" oft mark major turning points).
And yet as we also mused a week ago, if nobody owns Gold, how can they keep selling it? Tongue-in-cheek of course, as we on occasion recall from back in 2013 the Executive Branch requesting its Department of the Treasury to unload some Gold such as to ease the strain of "The Sequester", only to basically be told: "No, you don't go there."
Still Gold -- be it by lack of ownership interest and the ever-more apparent price suppression by the "M word" crowd -- is now priced where it first was some 11 years ago (02 August 2011) when the U.S. money supply was just 44% of that today, (the supply of Gold itself since then having increased by just 17%).
Regardless, the "conventional wisdom" axiom that "Gold cannot rise during Dollar strength" nor can it "during FedFunds rate increases" we've provably axed in the past per reprise of this remindful gem:
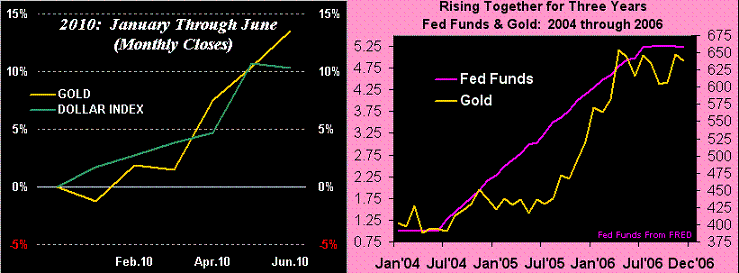
To wit, above left across the first six months of 2010, both Gold and the Dollar Index rose by better than 10%. And more broadly above right from 2004 through 2006 as the FedFunds rate rose from 1% to 5%, the price of Gold increased by as much as 97% low-to-high.
"So mmb, how long can the Dollar keep going up?"
Given as just shown that Gold plays no currency favourites -- even as more Dollars evidently make them worth more -- the level of the Buck at the end-of-the-day is irrelevant to the price of Gold, whereas the supply of the Buck ultimately is relevant. And as inflation proliferates beyond the States, other central banks are on the bandwagon to also raise rates. However within the Ugly Dog Currencies Contest, that which pays more interest gets the bid, in this case the Buck. Perhaps in a year's time, the Federal Reserve having crushed the StateSide economy, FedFunds rates shall fall whilst other sovereigns' rates still rise and maybe the €uro shall regain the bid; (ok, stop laughing out there). Again, "Got Gold?"
Now with but a week to run in Q3, what do we economically see? For the Economic Barometer we've thus far collected 73 month-over-month metrics specific to Q3: 31 have improved, 2 are "unch", and 40 are worse. So the "lean" purely from that is for a third consecutive quarter of Gross Domestic Product shrinkage toward "officially" maintaining the recession. 'Course the GDP itself hardly contains such intricate breakdown; rather 'tis the summation of a few Big Numbers thrown up onto the barn wall and what we get is what we get. Further -- as you know, and we know, and everybody from Bangor ME to Honolulu and right 'round the world knows -- the U.S. Department of Commerce's Bureau of Economic Analysis is going to count it all however they can such as to show GDP growth, especially in support of the Executive Branch's stating that neither is there a recession nor inflation. To be sure, with Q3 metrics still incoming through much of October, we'll see how the Baro looks in a month's time. Again, Q3 GDP is due 27 October. For the present (so you're told StateSide) 'tis all good:
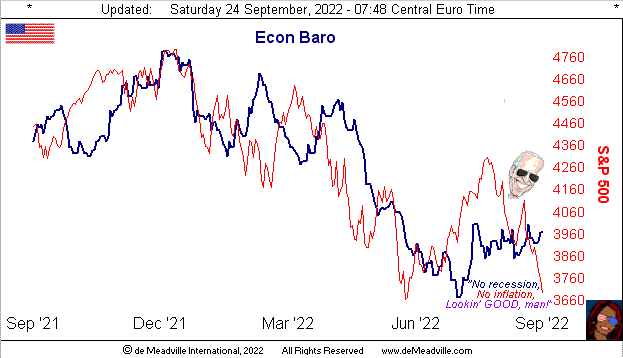
What's also good is that a U.S. railway strike was (for the present) avoided. But what's bad are negotiations for western U.S. port workers seemingly strike-bound. Add to that Fed-Ex seeing global transportation slowing (don't forget your Dow Theory), FedFunds hikes ongoing, and thus we've the S&P 500 finally re-pricing.
Where does the S&P's decline stop? Technically as you know ad nauseam: 3600-3200 is the support zone for the S&P, and it having traded as low as 3647 yesterday, 'tis almost there. Fundamentally should the S&P's price/earnings ratio again be reverting to its mean -- which with interest rates ever on the rise makes sense -- then as you also know ad nauseam we're looking at the mid-2000s (as we herein laid out in lurid detail a few weeks back). That's not a prediction, for if the 3600-3200 area holds and earnings significantly improve (i.e. not just "beat estimates"), the S&P can gather itself back together. (Good luck).
"But the stock market is way oversold now, mmb..."
Indeed by near-term "textbook" measures, (BollBands, Relative Strength, Stochastics) the S&P is quite oversold, Squire. Moreover, the S&P futures settled yesterday 292 points below their smooth valuation line (per the website's Market Values page). And yet by our MoneyFlow page, we've yet to see any real FEAR in selling the S&P to this point. 'Course, 'tis still September, followed by ("don't say it") October... And when in doubt, the trend is your friend (as is deMeadville ... a shameless plug, but most satisfying).
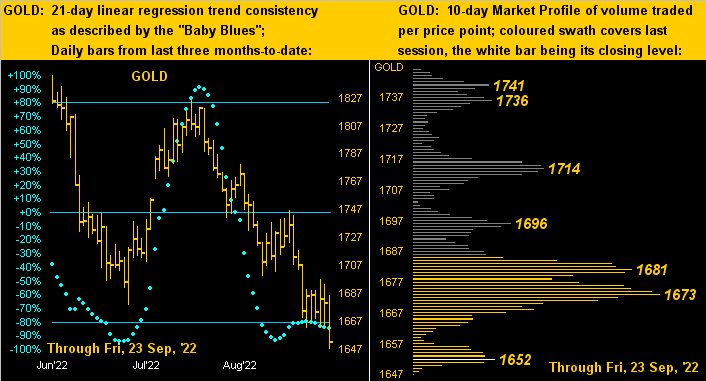
But hardly satisfying is the recent trend of Gold. Below on the left we've price's daily bars across the past three months, the "Baby Blues" of trend consistency still struggling to get off the mat. Then on the right in Gold's 10-day Market Profile the apices of the upper 1600s now show as dominant trading resistance:
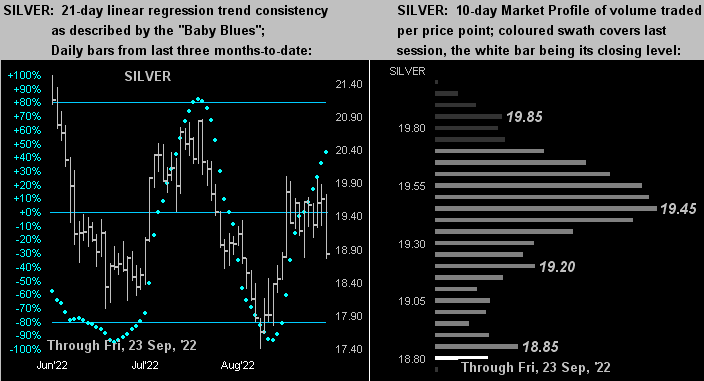
Silver however has clearly been comparatively better, her "Baby Blues" (at left) in ascent ... but her Profile (at right) now finding price buried at the base. And as woe is Gold, Silver just posted a sell signal effective Monday's opening per the daily parabolic study having provisionally flipped to Short at Friday's settle of 18.835. Should this very visible technical study garner selling, the typical downside follow-through would send Sister Silver into the lower-17s/upper-16s, which we'd expect to see IF Gold continues to slip:
To close, as noted a week ago, we're near to annulling our forecast high of this year for Gold 2254, (barring an improbably sizzling super rally this week, i.e. +100 or more points). We'll reassess this in a week's time, indeed a week for which 13 metrics due for the Econ Baro may give it a slight up nudge. In the meantime, nudge yourself to get some Gold: better to buy at the current price of 1652 than at the current valuation of 3984!
Cheers!
...m...

