2022 COPPER TECHNICAL VIEW
Demand outlook is very bullish for copper, nickel, and all base metals in 2022. Copper usage in DE carbonization and in electric vehicles result in higher demand.
Mine supply and recycled copper supply is the key factor that can affect the trend of copper in 2022. New mine supplies are coming upstream in 2022. No one actually predict how much recycled copper can come up in 2022.
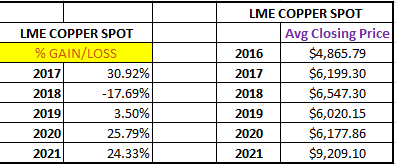
In 2022 LME Copper spot has to trade over $9209.10 (2021 average daily closing price) to be in a bullish zone.
Average closing price for past two years is $8710.65. All price fall or corrections (by whatever name called) upto $8710.60 will be a part and parcel of the bullish trend in copper.
Copper needs a daily close below $8710.60 for twelve consecutive trading sessions to fall to $7865.10 and $7057.10. Under the worst-case scenario I do not see copper price falling below $7057.10.
The above was a shortest possible view for a bullish trend. One needs to remember that twenty percent price fall will be a part and parcel of long term bullish trend in copper.
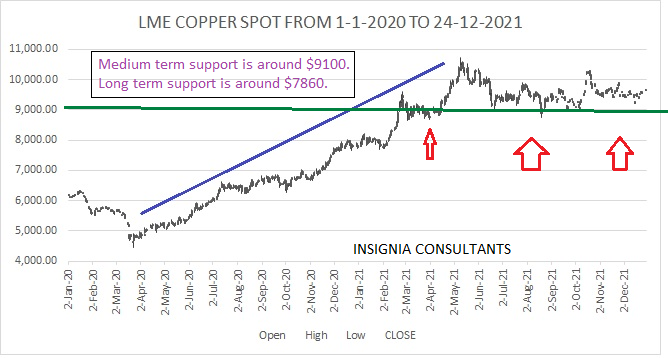
- 200 DAY MOVING AVERAGE: $9520.90.
- 100 HUNDRED WEEK MOVING AVERAGE: $7834.60
- Key support’s 2022: $7254.60, $7689.10, $8047.80, $8460.10, $8850.50 and 9082.80
- Key resistances in 2022: $9848.10, $10285.50, $10997.20 and $11088.10 and $12596.20
A number of people told me in Christmas vacations that copper prices will fall below $8000 in 2022. For copper price to crash (a) It needs a daily close below $9082.80 for two consecutive weeks. (b) Copper does not break and trade over initial resistance of $10285.60 by end January.
My View: Copper has to trade over $8974.40 till end April 2022 to be in a bullish zone and rise to $10755.20 and $11890.70. The next big sell off in copper will be there if copper trades below $8974.40 for six consecutive trading sessions to $8380.80, $7834.60 and more.
Will copper be able to break $12000 in 2022? Is there any chance despite all the not-so-bullish forecast?
- There has to be a mine supply squeeze for copper to break past $12000 in 2022.
- If global interest rates rise slowly then the copper price will break past $12000.
- Chinese domestic consumption exceeds the best of the forecast.
- If copper trades over $10161.60 for over a month then it will easily break past $12000 in 2022.
The biggest price risk to copper is A crash in global stock markets. Global stock markets moving into a medium term bearish phase is the biggest price risk not just for copper but for all industrial metals.
COMEX COPPER FUTURE TECHNICAL VIEW
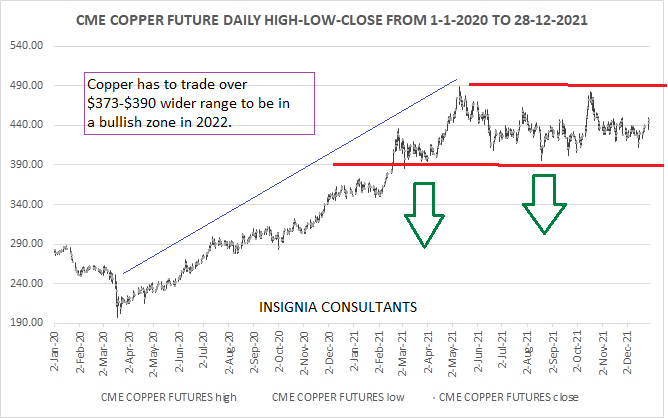
- Short term: Copper has to trade over $424.10 to be in a bullish zone $481.30 and $519.70 and $548.90. Bearish trend will be there if copper trades below $425.20 for four consecutive trading sessions to $405.10 and $373.40.
- Medium term to Long Term: Copper has to trade over $373.40-$389.90 to rise to $513.70 and $583.00 and $636.70.
- CRASH CASE: Failure to break $513.70 by early April 2022, will result in a crash to 373.40 and $356.90. Investor fatigue will be there in case copper does not break $513.70 by early April 2022.
- Average closing price in 2021: $424.10
- Average closing price of 2020-2021 combined: $352.00.
- I do not see copper price falling below $352.00 under the worst case scenario in 2022.
- Key support’s 2022: $366.80, $384.90, $405.10 and $425.60
- Key resistances in 2022: $461.30, $476.20, $496.60, $513.10 and $554.60.
MCX COPPER FUTURES
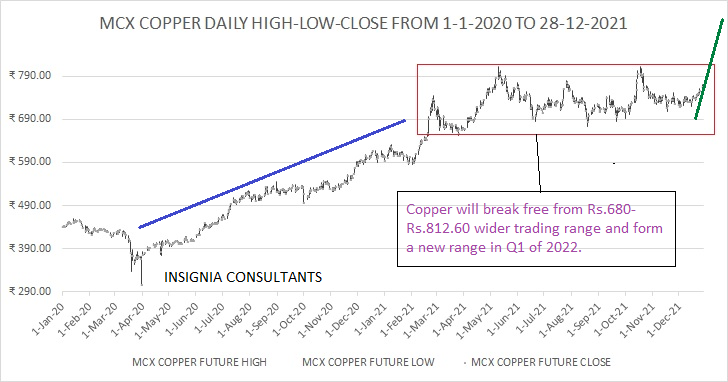
- Short Term: MCX Copper future has to trade over Rs.730.60 to be in a bullish zone and rise to Rs.791.40 and Rs.818.60.
- Medium Term: MCX Copper future has to trade over Rs.710.50 to be in a bullish zone and rise to Rs.818.60 and Rs.878.10 and Rs.938.20.
- Long Term: All price crashes upto Rs.663.80 will be a part and parcel of the bullish trend.
- CRASH CASE: Failure to break Rs.818.60 in MCX near term copper future by end March will result in a crash to Rs.663.80 and Rs.632.10.
- Average closing price in 2021: Rs.712.90.
- Average closing price of 2020-2021 combined: Rs.596.00.
- Key support’s 2022: Rs.601.70, Rs.623.50, Rs.663.80, Rs.709.90 and Rs.722.70.
- Key resistances in 2022: Rs.777.10, Rs.791.40, Rs.805.70, Rs.818.60 and Rs.878.10.
|
PERCENTAGE RISE/FALL |
|||
|
|
LME |
CME |
MCX |
|
2017 |
30.92% |
31.91% |
23.67% |
|
2018 |
-17.69% |
-20.39% |
-12.54% |
|
2019 |
3.50% |
6.31% |
11.23% |
|
2020 |
25.79% |
25.81% |
33.28% |
|
2021 |
24.33% |
25.97% |
26.50% |
There will be a divergence in copper price in various exchange. Local currency price fluctuation and differential taxes are the reason. However, this provides an excellent arbitrage opportunity.
LME COPPER-LME ALUMINUM SPREAD/PRICE GAP
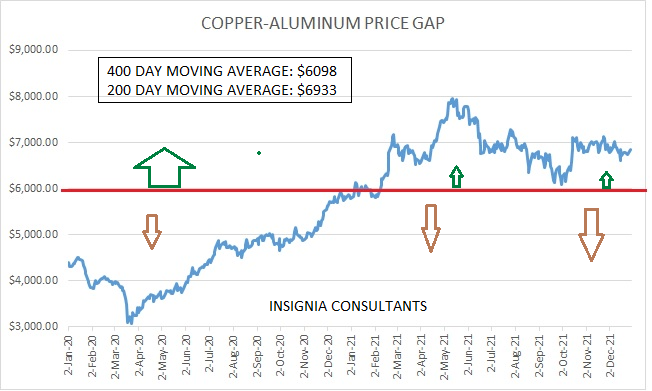
Any copper report is incomplete without knowing the trend of price gap between copper and aluminum.
Copper-Aluminum price gap has to trade over four hundred day moving average of $6098 to be in a bullish zone.
Traders will prefer to aluminum over copper as long as price gap is over $6098.
Copper will be preferred over aluminum if the price gap is below $6098 for over thirty consecutive trading sessions.
Copper price will break past $12000 if the copper-aluminum price gap trades below $6098 for thirty consecutive trading sessions.
TO CONCLUDE
Copper price will be very volatile in 2022. Physical buyers and physical sellers need to a keep a close watch on daily price. They should also know when trend is about to change. I am against keeping high physical stock at current price.

