The Gold Update by Mark Mead Baillie --- 654th Edition --- Monte-Carlo --- 28 May 2022 (published each Saturday) --- www.deMeadville.com
As we did a week ago -- since they're still all the rage -- let's start with stocks, "up first on our schtage", [thank you, Ed Sullivan].
And how about a "standing o" for that soaring S&P 500, Ladies and Gentlemen! This past Thursday -- after having been "textbook oversold" for 25 consecutive trading days -- the S&P 500 unwound said stance. Oh to be sure, the Index's regression trend (21 days) remains negative; but the S&P has just recorded five net gains in the past six trading days, including a +5.5% net gain in just these past three days toward finishing the week yesterday (Friday) at 4158. Pretty great! Especially when you consider:
■ the ongoing deterioration of the S&P's Moneyflow -- a critical, tried-and-true leading indicator -- that now values the S&P -9.1% below its present level to 3781;
■ the Wednesday confirmation from the Commerce Dept.'s Bureau of Economic Analysis that Q1's Gross Domestic Product shrank in both nominal and real terms;
■ the interest rate environment being positive and yet the "live" price/earnings ratio of the S&P now being 31.8x versus its lifetime mean of 22.3x;
■ the Economic Barometer having just reached a 14-month low to complete the week.
Therefore: let's all buy stocks like there's no tomorrow!
Today's fund managers are right out of Ivan Pavlov's dog kennel. (Well not all of them: we were informed during the week of Morgan Stanley targeting the S&P mid-point of 3400 within the 3600-3200 support zone, which as you'll recall from last week's missive is about where the S&P would be today had COVID not been created). But either way, in the spirit of our oft-quipped headline "World Ends, Dow +2", the S&P's low-to-high gain for the week was 283 points: that amount exceeds the S&P's entire trading range of the year 2015 (which was 268 points, just in case you're scoring at home).
But the bottom line from our truth-and-data-driven purview is that getting sucked back into stocks up here is a bad idea. Or as written a week ago: "...Our expectation near-term from here is that the S&P unwind said "oversold" stance, whilst remaining in the broader downtrend toward the noted support zone..." Nuff said.
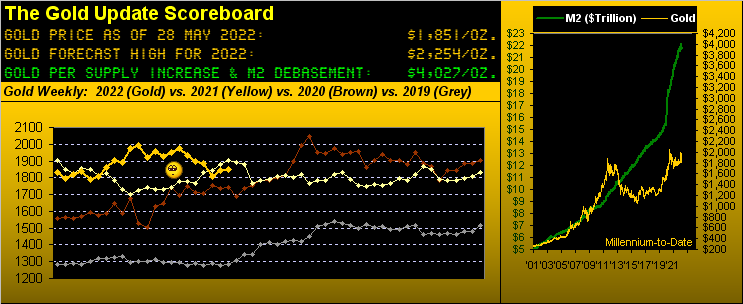
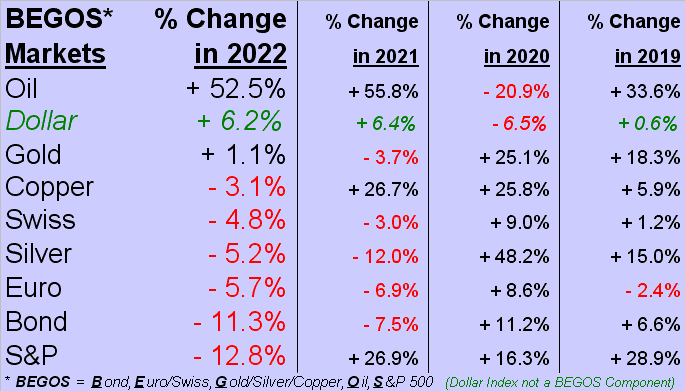
As for the main act -- Gold -- it at best keeps yawning along, settling yesterday at 1851, up a scant six points for the week, and all but above the oft-emphasized 1854-1779 critical support zone. Of the five primary BEGOS Markets, Gold's low-to-high percentage range for the week was the narrowest of the bunch. And overall for 2022-to-date, here's the whole gang, Oil leaving the pack in the attrition, and boring Gold a with weak podium position:
Still, there was a moment of hopefulness this past Monday when both Gold and Silver generated "BUY" signals upon their "Baby Blues" (graphically shown later in this missive) gaining ground per this end-of-day internal alert...
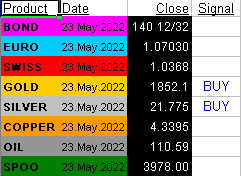
...but little has yet come of it for either the yellow or white metal.
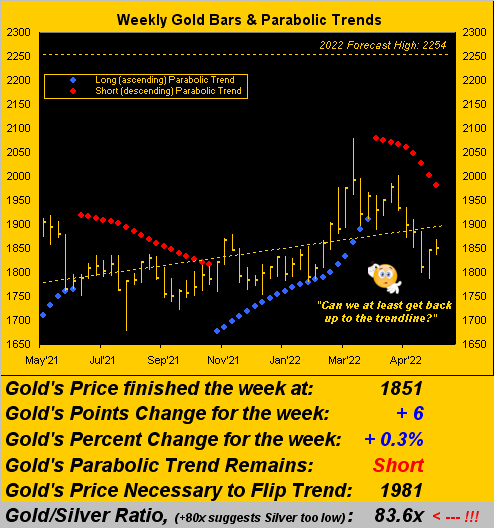
Thus we've next Gold's weekly bars from one year ago-to-date, the parabolic Short trend now nine weeks in duration and keeping the cover on price:
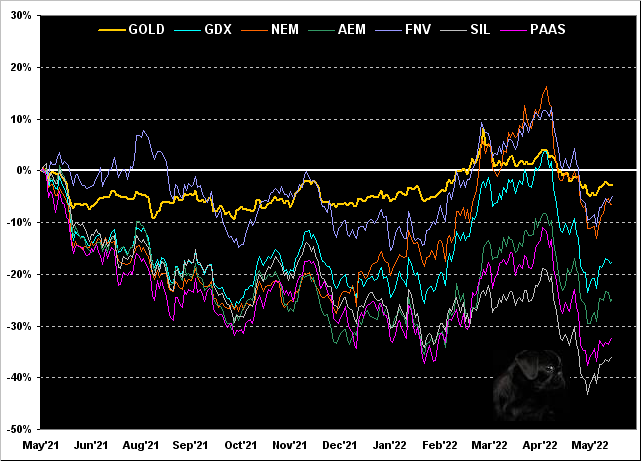
As well from this date a year ago through yesterday we've the percentage tracks of Gold along with those of several key precious metals equities. The
Speaking of dogs, as earlier stated, the Econ Baro -- amidst all the frothy stock market euphoria -- reached a 14-month low yesterday. ('Course, that isn't going to be on CNBS, Bloomy or Foxy, their not wanting you to change the channel). Here's the raw reality, apparently unbeknownst to the happy stock chaser:
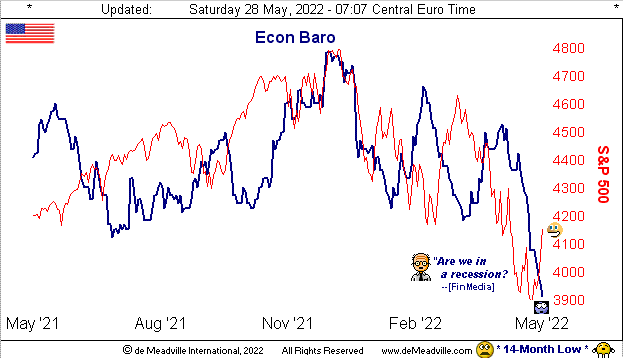
Therein from the FinMedia Follies, Dow Jones Newswires queried: "Are We in a Recession?...people [are] talking about a possible
Mid-week within the overall stagflation situation came the Federal Reserve's favoured inflation gauge of April's Core Personal Consumption Expenditures, the same as the March reading of +0.3%; (the 15-year average monthly reading is +0.2%). So a tad high, and annualized, 'tis +3.6%. But hardly Jimmy Carter Era skyrocket numbers; and assuming that neither do you eat, nor travel, and live in a temperate tent, you're probably gonna make out just fine.
That cited, 'tis said the Meeting Minutes (03/04 May) from the Fed infer an "urgency" to keep raising rates, especially so as to slow the housing market, even as April's New Home Sales fell the most in nine years. Nothing like being in sync, eh?
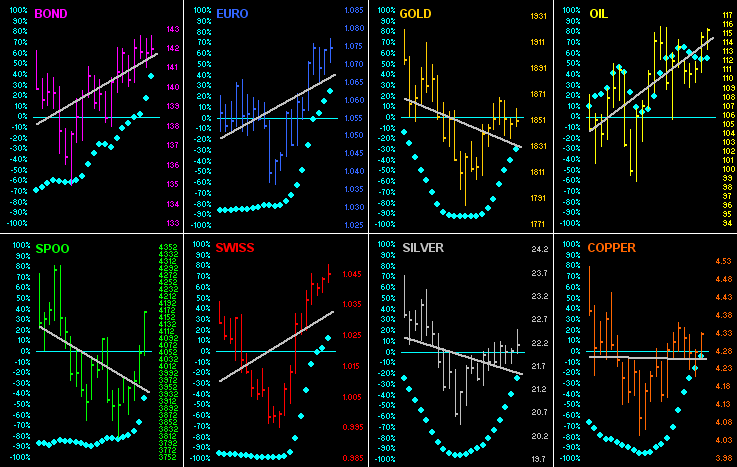
Let's next get in sync with the linear regression trends for all eight BEGOS Markets. Going 'round the horn across the past 21 trading days (one month) we see the aforementioned "Baby Blues" for the grey trendline consistencies rising for every component. Getting complacent, are you? Careful...
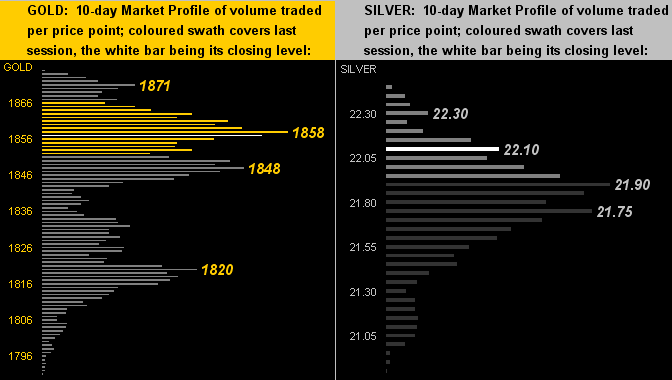
And specific to the precious metals, here are their respective 10-day Market Profiles for Gold on the left and for Silver on the right. Those prices carrying the most traded volume are so labeled:
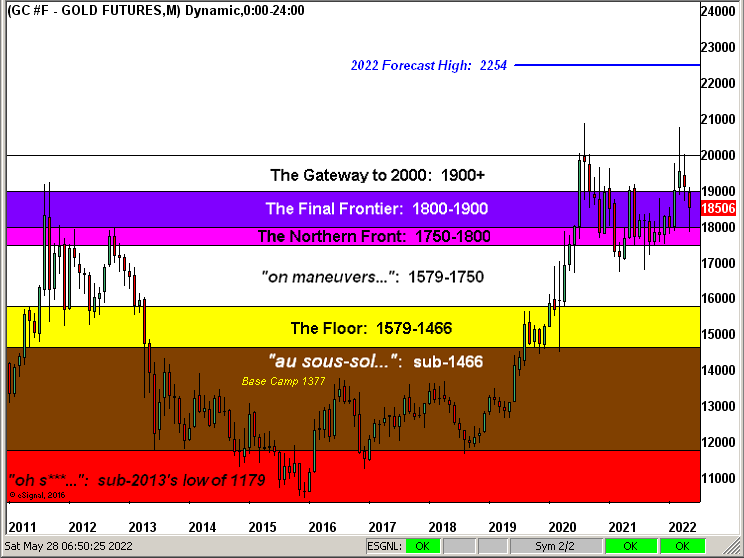
Finally, it wouldn't be month-end (save for one full trading day still in May, Monday being a StateSide holiday) without the Gold Structure. Here 'tis, charted by the month since the year 2011. Therein is Gold's endless battle to regain The Final Frontier:
To close, we've these three quickies ahead of a week economically busy:
■ St. Louis FedPrez James "Bullish" Bullard is said to be considering a rate cut as a possibility during 2023. That's called begging the obvious question;
■ From the "Just Because Yer Rich Dept." we read of a noted "billionaire" by the name of Ackman crediting Fed irresponsibility for the markets "imploding". We "get it", but rightly or wrongly, (this last week's relief rally notwithstanding), we instead credit the implosion with the aforementioned ever-ongoing unsupportive level of earnings ... and too, a far better, less risky return from the Bond market;
■ A just-released Fed survey taken late last year (what's the point?) finds Americans to be strongly positioned financially. Not having seen the survey content, we wonder if the results included "marked-to-market" assets. (See the cellar dweller in the aforeshown table of the 2022 BEGOS Markets' performances).
See to it as well that you've Got Gold!

Cheers!
...m...

