
(YouTube Full Interview Link: https://www.youtube.com/watch?v=eNwDJO_az2U)
Tekoa Da Silva: John, I've been following your Shadow Government Statistics inflation commentary for most of my adult life. For the person reading who may not be familiar with your work, what do you track and produce in your publication?
John Williams: I look at US government statistics, the major ones that are followed by the public as well as trying to assess the underlying economic reality, along with inflation. That includes economic activity as measured by the gross domestic product (GDP), and inflation as measured by the consumer price index (CPI).
In particular, the numbers I look at and analyze are the government's reporting where they play games and change things. Over time, particularly with the CPI, which is used so broadly by individuals and commerce, the reported numbers are heavily understated.
That underreporting goes back to the 1980s-1990s when the US congress was upset about a big boost in the cost of living adjustments to social security payments, which was due to the higher reported inflation. That cost of living adjustment cut into the deficit spending they could do – at least described to me by people in congress.
So they looked for ways of reducing the reported headline inflation, and thereby reducing the upward cost of living adjustments to social security payments.
Katherine Abraham, Clinton Bureau of Labor Statistics commissioner, recalled sitting with house speaker Newt Gingrich. She noted him saying, “[I]f you could see your way to doing these things [reducing headline inflation numbers], we might have more money for the BLS program”.
He wanted them to find ways to lower the cost of living adjustments so they weren't so constrained in terms of the deficit spending they could do.
TD: So these adjustments to the CPI measurement put out by the Bureau of Labor Statistics were made to reduce the stated rate of inflation in order to shortchange Social Security recipients. Is that right?
JW: That is correct. And they're very open about it.
TD: I see. John, I understand that early in your career, you provided economic consulting work to a commercial airplane manufacturing company. How did you find yourself following these government numbers?
JW: I went to Dartmouth College and the Dartmouth’s Tuck Business School. At Tuck, I got into econometric modeling where you would work on discovering mathematical relationships between different variables. Sometimes we would work on meaningful equations or relationships that help you forecast what might be happening in the future. But I finished school back in ‘71.
I was also in a family business, and did some economic modeling there. We sold the family business and I started my own economic consulting firm, and did specific work for private companies.
Later when the government starting fudging the numbers, I noticed it given my background, and I was offended by it. The government wasn’t living up to their agreement with the average American, so I started tracking it and publishing the numbers myself.
The government made upward adjustments to the employment numbers to make the unemployment rate look better. As I got the alternate numbers together, I started publishing a newsletter called ShadowStats, which offers alternate estimates of the CPI inflation rate the way it used to be calculated. The same changes are occurring with the
I also look at employment data, and there are some serious issues with the government employment numbers. I also look for consistency in the numbers over time. The government just redefines numbers and then doesn’t talk about it. At least in the private sector, you’re required to have consistency in your reporting. And if you don't, you at least have to have good footnotes on it.
So there have been a number of changes made to the government figures. And the changes were made after the deal sealed with the public, on setting cost of living adjustments. That was based on the CPI at the time. But there was no clause in there that said, “Should the government change, the CPI will be reduced, along with the payments.” If that were a private contract, your original deal would have held. You would have the cost of living adjustment you agreed to.
But they changed the terms after the fact. That's very difficult to do in private business, but the government can get away with it.
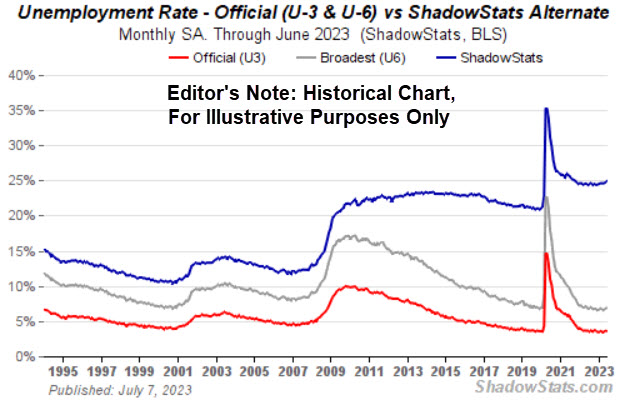
With the unemployment numbers, they reduced the headline figures as well. They survey the unemployed, but if you're unemployed and not actively looking for work because you've given up – they only count you as discouraged for 6 months.
After 6 months, if you're still discouraged, they don't count you anymore. I continue counting. If people are discouraged and they want to work and there are no jobs to be had, they're still unemployed as far as I'm concerned. So I get much higher unemployment readings than the government does with its headline numbers (as shown by the blue and red lines below):
Probably the worst number published by the government is one of the most widely followed, is the GDP number – the total measure of economic activity in the United States. It's estimated in nominal terms before adjusting for inflation. If you look at GDP for the last several quarters, the year over year growth adjusted for inflation, is reported at around 3.0%-3.5%.
But there's a problem with that number. I look at every economic statistic I can, for unusual trends. One of the best indicators I follow is a private measurement called the Cass Freight Index. They track domestic freight, the shipments of goods. There's no better indication of broad economic activity than freight activity. It's been down year over year for some time now.
You can look at retail sales which are reported in nominal terms. That's before they adjust for inflation. The economic numbers are usually adjusted for inflation because otherwise what looks like economic growth may be just inflation.
So the headline CPI is understated, and if it’s used to ‘inflation-adjust’ the GDP or other economic numbers, it will end up overstating the real economic growth. That’s one of the gimmicks the government uses.
Currently if you take reported GDP and adjust with an accurate CPI number, it's down year over year (as shown by the blue line below):
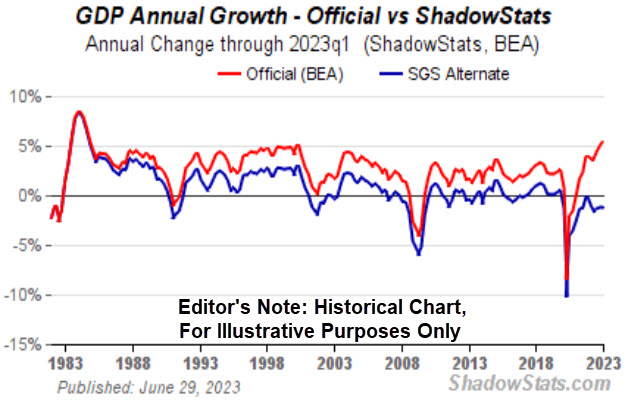
Housing starts are also down year over year. So is industrial production. All the monthly economic numbers are down, yet the GDP is up 3.00%+. It's nonsense. The government GDP number is heavily constructed and gimmicked. But we've just had an election, so what can I tell you?
So my contention is the US economy is stagnant to negative right now. I think you'll see official downward revisions and reporting in the GDP, now that we're past the election. But that’s nothing new. These things have happened many times in the last 15-20 years. It's a perk for the government to be able to tweak the numbers a little bit to help politically, before elections.
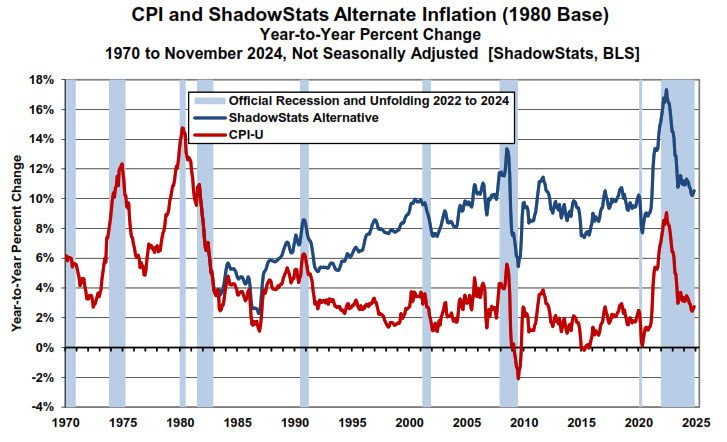
TD: We're having this conversation in December of 2024. What are your figures showing you in terms of likely annual CPI inflation rate in the USA, you're currently? Right now the government says the headline number is 2.60%, correct?
JW: Correct, that's what the government is saying, 2.60%. Before they started playing games with how they measure the CPI, it would be around 10.40%. It's a difference of about 8.00% (as shown by the blue and red lines below):
TD: Before the interview, you were kind enough to send me a chart, which helps with my next question. Is there a correlation between the US dollar gold price over time and your compounded annual inflation figures? Can you walk us through this next chart below please?
JW: Sure. What you see below is a chart going back for some time, which shows the estimated headline inflation against the price of gold:
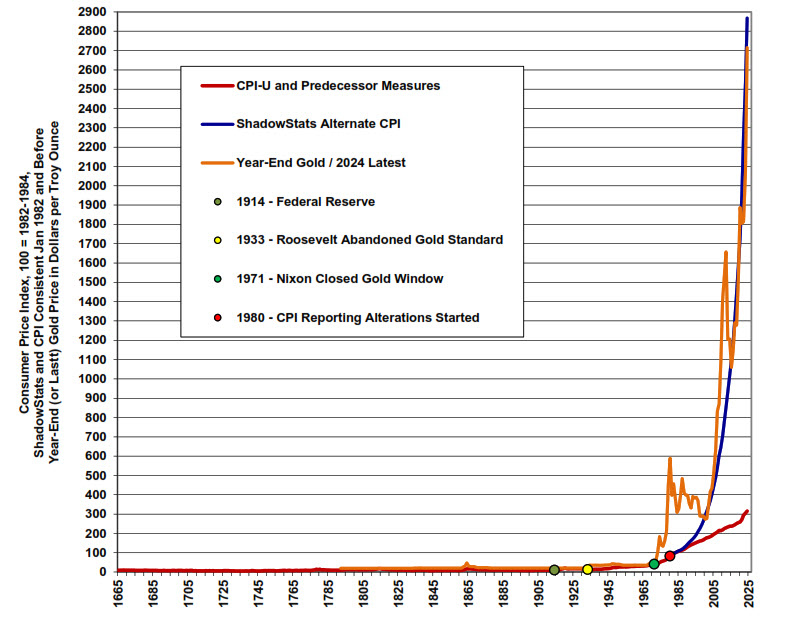
If you look at the right hand side you'll see there's a line that splits in two; one at a lower level in red, and one that starts to rise in blue. The red line at the lower level is the officially reported headline CPI. The rising line in blue is my alternate CPI estimate based on what they started subtracting out of it.
The jagged orange line is the annual price of gold. The spikes in that orange line are people anticipating crises and inflation over time. This also shows that physical gold is your best hedge against inflation.
Right now this chart shows that Alternate CPI inflation is a little ahead of gold. But they generally move together. So what I recommend if you're looking for an inflation hedge over time, is to own physical gold.
When I say physical gold I suggest common date bullion coins that don't have much numismatic value. The metallic value itself has worked out well as an inflation hedge over time. You get volatility, but again, if you hold the physical gold as a store of wealth, it will protect your purchasing power over time. It's not perfect. But over the years, it has worked.
TD: The political environment we're in seems more volatile than in recent years. When you look at what's going on - wars occurring around the world, political saber rattling, the fiscal situation here in the US - what goes through your mind about the future of the US dollar, CPI, and gold prices?
JW: Gold will tend to move with inflation and protect the purchasing power of whatever currency you're in. That's been the nature of the metal over time. Right now, I think we're in a very dangerous circumstance in the United States, both from an inflation and economic standpoint. The leading indicators I have on the economy suggest the real economy is flat to minus, and it's going to tank.
I'm not seeing any up economic upturn. It's getting weaker. At the same time, the inflation numbers are getting worse. What’s driving the inflation right now are several items, and they are not quite as advertised.
The Federal Reserve is a central bank, and its primary clients are the banking system. It also has responsibilities for monetary policy in the country. But its primary concern is keeping the banking system solvent and afloat. If you look at where the recent inflation came from, it occurred when we hit the pandemic.
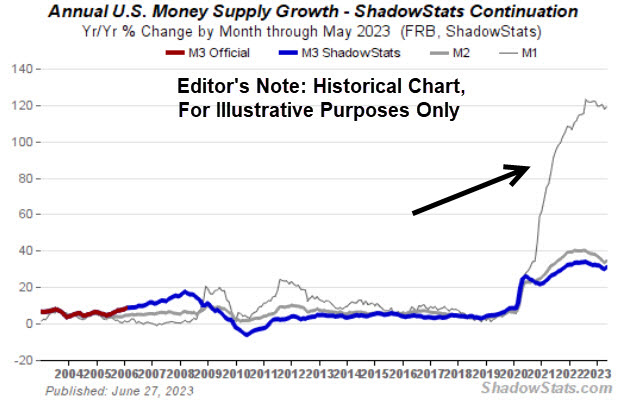
The Fed pumped 30 years’ worth of monetary stimulus into the system in 1-2 months, as shown in the chart below. That was to keep the banking system afloat. It was extraordinarily inflationary. That money supply created is still pushing the inflation.
There's another factor contributing to inflation, which is being done by the federal government. It's the extreme deficit spending. Those two factors are driving the inflation.
Now if you go back to the days when the pandemic hit, the Feds said, “Oh my goodness, the reason for the inflation is the economy overheating.” Nonsense. There was never an overheating economy during the pandemic. I challenge anyone on that. But that's what they used as justification for raising interest rates.
They needed to pump money into the system to support banking liquidity and they raised rates to keep the banking system solvent. Their primary function is to protect the banking system. And the big inflation problem came from the money supply creation which is still there.
If you looked at the money supply growth at the end of the first year of the pandemic, you saw a big surge in the money supply. It was up 58% year over year. And that is really unprecedented, but that's what gave us the headline inflation. And it's still there. They haven't taken it out, despite the current money supply growth being flat.
That's driving the inflation. They know it. Their actions, their excuses, are all guided toward keeping the banking system afloat. It's a conflict of interest that's never been resolved.
On the other hand, the federal government has been very open about deficit spending. It's been spending money without concern of containment. It just keeps growing. Both of those factors; the Fed's money supply and the Federal debt and deficit are driving the inflation. And the headline inflation is really not coming down. I'm tracking as it used to be counted, and it’s somewhere around 10.40%.
That might be down from the pandemic high of 16.00%, year over year - but as I mentioned, the bulk of the money supply is still there. So the year over year numbers are not yet as meaningful as they could potentially be.
It's a dangerous circumstance, and what I'm seeing ahead is higher inflation and a recession beginning to take hold. We're already seeing it. It's in the underlying economic statistics. The underlying numbers representing economic activity as the average person sees it are not doing well. We never really recovered in real terms, from the pandemic driven economic collapse.
I know my numbers are somewhat controversial. But the Federal Reserve and the government's bias are political, and they boost headline economic numbers and depress CPI numbers.
The pandemic put economic circumstances in turmoil. It's beginning to calm down now, but the damage is still there. The liquidity driving the inflation is still there, but it's needed to keep the banking system stable.
So it’s still a dangerous time. There is also the risk of a hyperinflationary economic collapse. That would be the worst of all worlds. Gold would preserve your purchasing power during a runaway inflation. That's been seen time and again throughout history.
TD: John, you mentioned the risk of a hyperinflationary scenario. Would there be early warning indicators of something like that being imminent? Or do you just have to wait and see if it happens?
JW: I'd watch the price of gold. You’d see a surging gold price. That would be an indicator.
The government's going to try and cover up the inflation rate. I figure its underestimated year over year, by about 8.00%. That'll pick up too.
I think you'll see the headline CPI numbers pickup as well. But watch the gold price. If you see a soaring USD gold price and no big movement in the CPI, I'd question the CPI.
TD: John Williams, thanks for sharing your comments with us.
JW: It's been an absolute pleasure. Thank you, sir.
John Williams’ website archive can be found at: ShadowStats.com
To reach the author, Tekoa Da Silva, visit: x.com/TekoaDasilva

