- Will Jay Powell be “less hawk than expected” today? Will there be a huge stock market rally to celebrate his return to a dovish stance for markets?
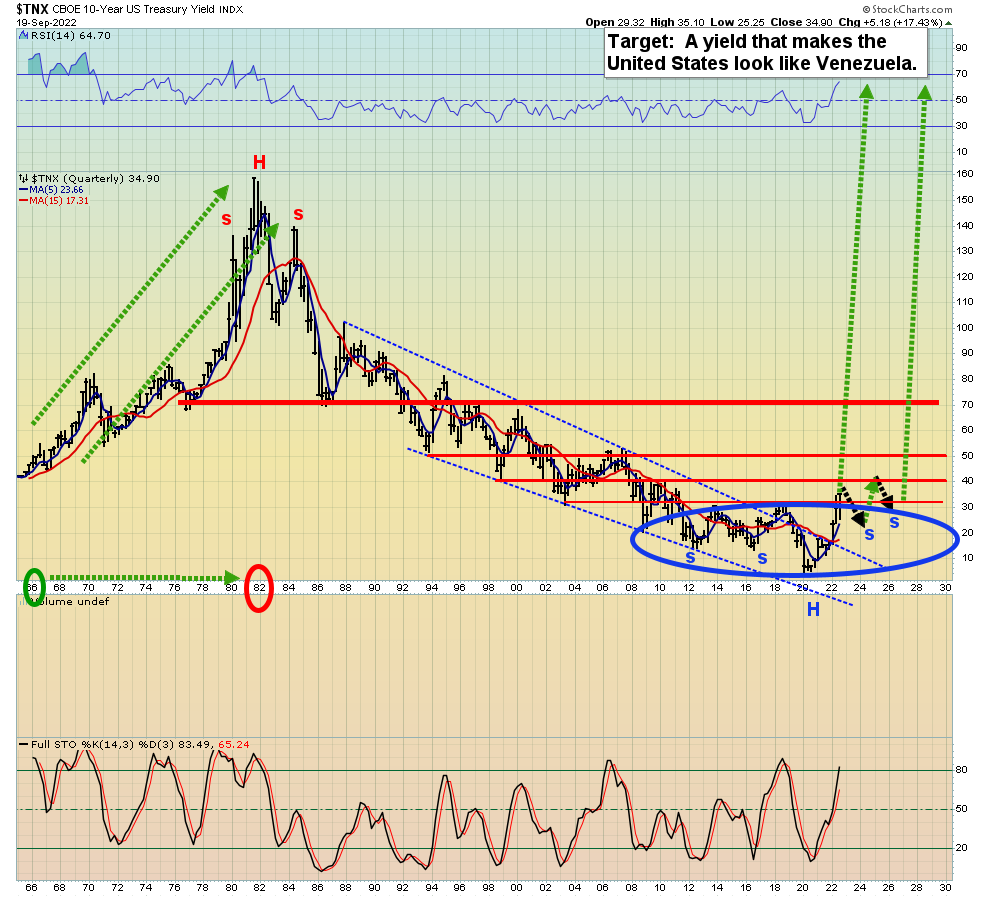
- For my take on the matter, look at this chart:
 Double-click to enlarge this long-term US rates chart. It’s possible that there’s some short-term pause in the rise of inflation and rates but…
 - In the big picture, it won’t matter what Jay says or does today; US rates appear to be heading far higher (and rightly so) than most investors think is possible.
- Please click here now. Double-click to enlarge this TBF versus gold chart. This ETF gives investors direct exposure to profiting from the Fed’s hiking cycle and I consider it a “must own” for serious gold bugs around the world.
- I’ve been recommending it since the Fed hikes began. Is it too late to buy now? No, and here’s why:
- US rates are in a base pattern that should push them to above the 1980 highs… and they are about 80% below those highs now.
- What about the stock market? Well, please click here now. A CAPE ratio of 20 is high. It’s 29 now, barely below the highs of 1929.
- This is not a time to be “averaging down” in the stock market, but there will be short-term opportunity for traders and on that note, please click here now. Double-click to enlarge this Nasdaq ETF chart. The 10,100 moving averages have done a good job of signalling short-term moves for traders.
- Sadly, there’s no buy signal now and the current decline could turn into an “avalanche” if Jay comes out as “more hawk than expected” tomorrow.
- Savvy traders wait for Jay to signal the next play rather than trying to outsmart him.
- A long-term hiking trend related to inflation likely means the stock market good times are finished for the next 20 to 30 years in America, but what about gold?
- There’s an ebb and flow to the inflation and rising rates super cycle. An all-weather approach to investing is required for investors to be happy… and to succeed.
- The “ebb” sees cash and direct bets on rates (think ETFs like TBF) do best, and the “flow” sees gold and related items do best.
- Please click here now. Double-click to enlarge this weekly gold chart. It’s unknown whether price moves up to above $1810 or down to $1610 next, but those are the zones for mining stock enthusiasts to focus on for buying.
- Note the 14,5,5 Stochastics oscillator at the bottom of the chart. It’s reached oversold status. A crossover buy signal would be a positive development...
- And it looks imminent.
- Next, please click here now. Double-click to enlarge this weekly GDX chart. The Stochastics oscillator is also heavily oversold.
- Rallies of 20% or 30% (and sometimes more) are typical from this position.
- Please click here now. Double-click to enlarge. It’s a similar Stochastics situation for GOAU, and there’s a bullish non-confirmation of RSI with the price.
- A rally to $16-$18 seems likely.
- The dip under $1675 for gold will attract some Indian interest but the faltering global economy means demand from both China and India will remain muted.
- That puts a limit on upside action… until the next wave of inflation in America begins. That’s almost certainly to be launched by a surge in the price of oil.
- As the winter begins and European governments reduce imports from Russia “to save freedom”, oil should begin another bull run.
- At that point, the Fed leaders will have a big decision to make. Do they accelerate the pace of hiking to manage the second wave of inflation…and risk causing an implosion of the government bond market? I think they do… and as it happens, America’s money managers will begin to relive the 1970s, with a ruined bond market, substantial stagflation, and a big focus on gold!
Stewart Thomson
Graceland Updates

