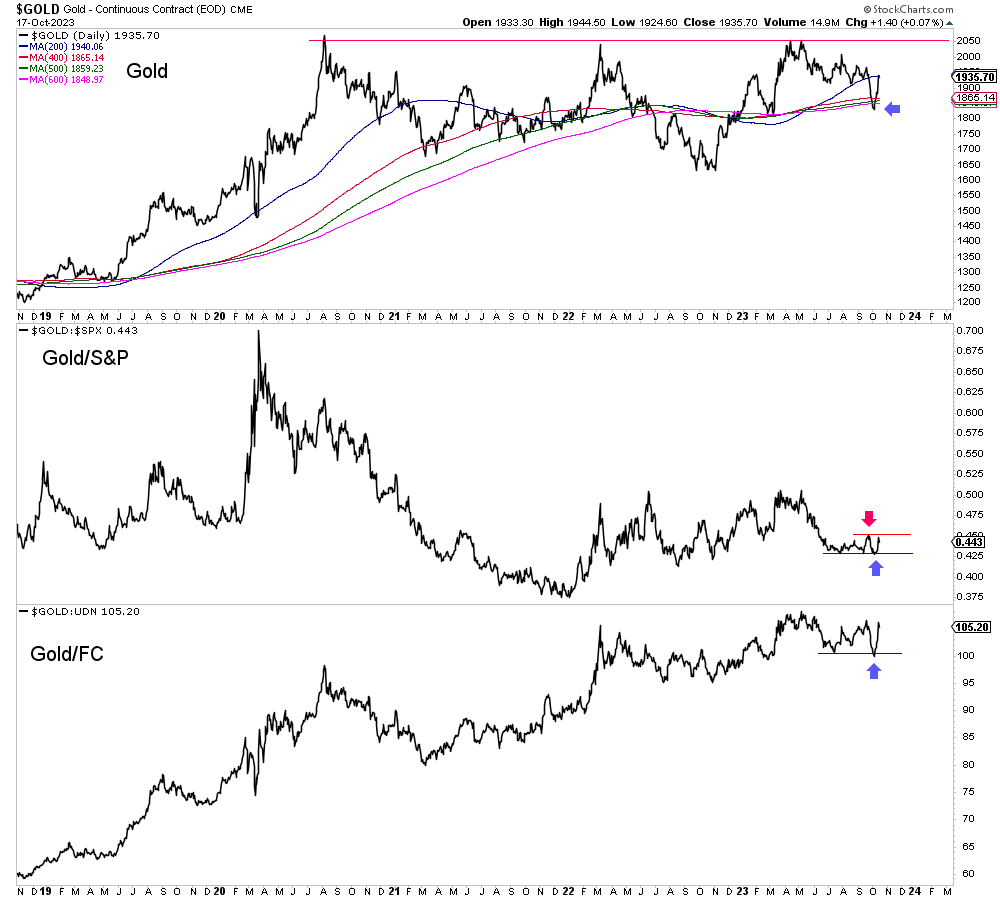
Amid escalating conflict in the Middle East and its oversold condition, Gold surged higher last Friday to nearly $1945/oz.
That surge occurred days after a bullish intraday reversal from $1823/oz on October 6 and a gap higher on October 7. Then Gold continued higher for a few days before Friday’s explosion.
In September, Gold broke down and lost support at $1900, losing the 40-month moving average and 50% retracement around $1850/oz.
In the chart below, we see how Gold had lost its band of long-term moving averages (side arrow), Gold against the S&P 500 had closed at an 11-month low, and Gold against foreign currencies had closed at an 8-month low.
Those fledgling breakdowns quickly reversed, and Gold holding above $1900 would confirm a false breakdown. Moreover, if Gold against the S&P 500 could surpass the red line (red arrow), Gold in nominal terms could rally back to $2000 or even $2050.

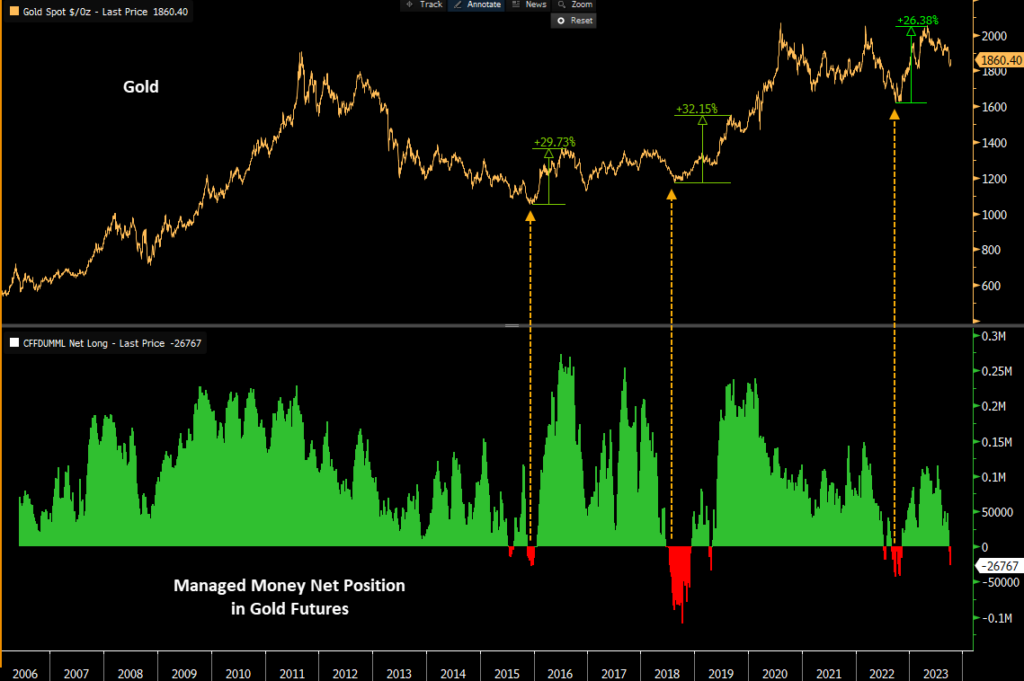
Another thing that will help Gold is the lack of bullish positioning and speculation in the market.
The chart below from Jason Goepfert of Sentimentrader.com plots Gold and Managed Money’s net position. Managed Money is part of the Commitment of Traders Report (CoT).
Hedge Funds (otherwise known as Managed Money in this instance) were net short Gold as of a week ago. Gold, then, was only 9% from an all-time high.

This is a potentially dangerous time for Gold bears.
Ongoing secular bull markets in the stock market and the US Dollar, in addition to the second strongest tightening cycle in modern history, have kept Gold from breaking out.
However, Gold remains within spitting distance of that breakout. It is only 7% from a new all-time high, and selling pressure over the weeks ahead should be more limited than during last spring and the spring of 2022.
Technicians have a saying. From false moves come fast moves.
Gold could digest its gains for a while, but pushing up to $2,000 soon could lead to an imminent breakout. That breakout is what all miners and juniors need.

