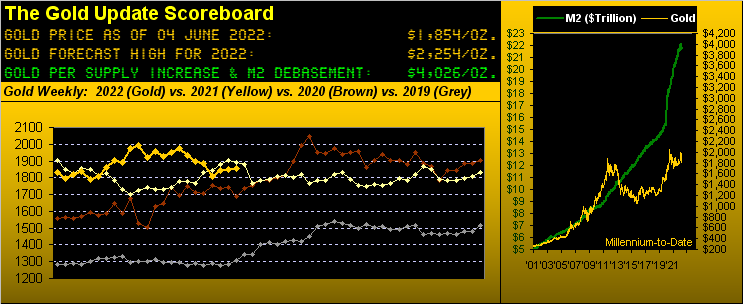
Its price more wandering than trending, Gold nonetheless just sported a three-week high (1879) under the umbrella of the otherwise declining parabolic Short trend, as we begin with the weekly bars from one year ago-to-date:
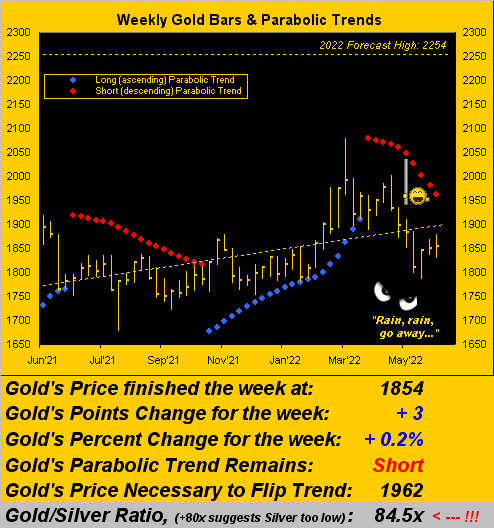
Upon such trend commencing 10 weeks ago at Gold 1929, price has since descended as much as -144 points (-7.4%) to 1785. Of more import however, Gold's underlying support zone (1854-1779) has thus far done a masterful job of protecting price from an all-out plunge per the shaded area as next shown within this year's performance by the day-to-date, highlighted as well by the RUS/UKR anticipated spike 'n fade:
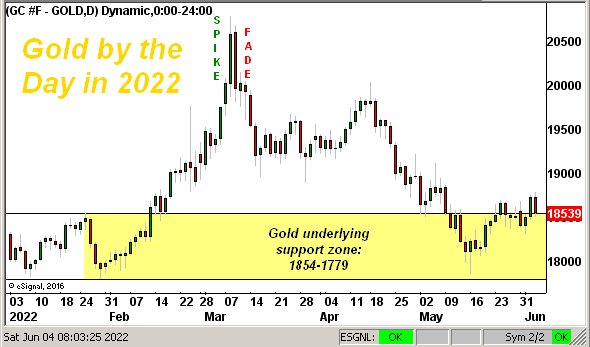
'Course, you know, we know, and every holder of Gold from Bangor, Maine to Honolulu and right 'round the world knows that -- such current technical negativity notwithstanding -- Gold by its purest fundamental measure (currency debasement) remains uncannily underpriced. In settling the week yesterday (Friday) at 1854, price is but 46% of the opening Gold Scoreboard debasement valuation of 4026.
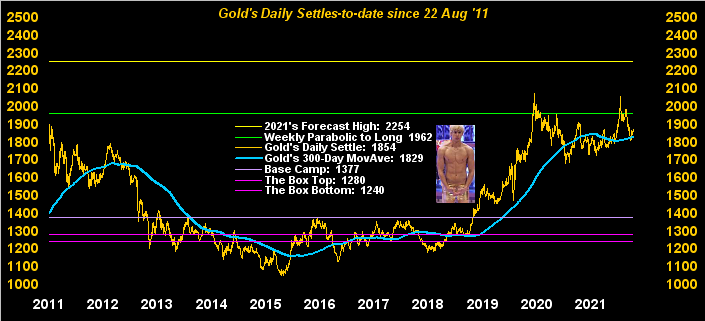
Moreover, we're maintaining our forecast high for this year of Gold 2254, the top line as we turn to Gold's daily closes across the past 11 years. To be sure, 'tis a teeth-puller to this point, but price can achieve 2254 in a heartbeat, which -- when it so does -- likely leads to significant follow-through. (To wit, a most valued reader informed us this past week of a published call for Gold 3000+ in fairly short order, which would indeed eviscerate Gold Short Smart Alec. Note too that Gold's stalwart 300-day moving average has resumed bending upward; (nice pants, Al...):
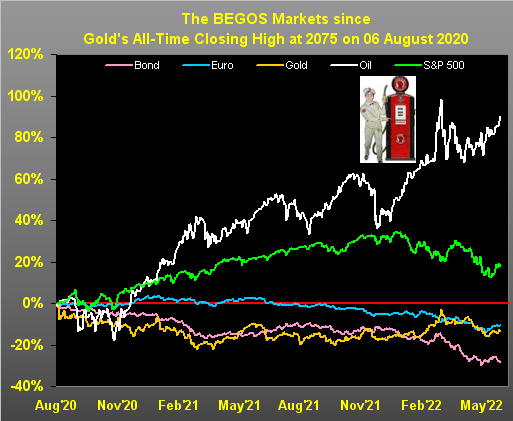
And relative to Gold's BEGOS Markets brethren, here we've the percentage tracks of the primary components (Bond/Euro/Gold/Oil/S&P) since Gold's All-Time Closing High at 2075 on 06 August 2020, the world by then having come to its COVID-induced halt. Since that day, the
Meanwhile as Gold wanders, stocks have resumed their flounder, the S&P 500's recent relief rally (+7%) having -- 'twould seem -- concluded this past Thursday. And you regular weekly readers know the rationale: the earnings aren't there, the MoneyFlow remains materially negative (even through the relief rally), and the
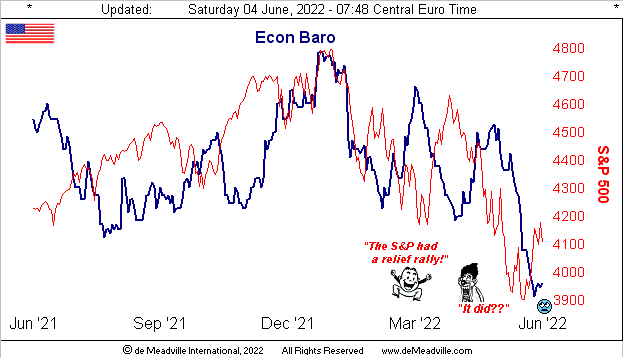
And as if precisely on cue, we just read that (courtesy of Bloomy): "Citi Team Downgrades US Stocks on Recession Risk" ... with a lean toward
As for the Federal Reserve -- and this it not something we state lightly -- 'tis becoming more and more apparent that they're losing control of the narrative. Lest we forget, the mandate of the Fed is to maintain stability of the U.S. Dollar. Yet with the Dollar being debased, 'tis been inanely increasing in relative value as cited in our 21 May missive: "...[from] the week ending 19 February 2021, the StateSide "M2" money supply and the Dollar Index are now both +14%..."
But more broadly: the Dollar Index from November 1985-to-date is now -21% ... and yet since then the M2 supply is +925%! (Indeed, what does that say about the €uro, ¥en,
Today, we've a Fed fumbling about the field intent on "raising rates this year so we can lower 'em next year" ... it makes one wonder why the Fed's even here. Regardless for the moment, FedGov Chris "Up The" Waller infers they keep an aggressive rate hike pedal to the metal, as does Cleveland FedPrez Loretta "Jump Back" Mester, the latter opining that such action can be taken whilst escaping an economic downturn: honey, 'tis a little late for that given a glance at the above Econ Baro. {sigh, we try...}
Then mix in the U.S. Executive Branch which claims no "immediate action" can be taken to tame inflation, notably as it affects oil prices and food. The practicality comes to mind of ramping up energy production via domestic pipelines and refineries, but as that would hasten the imminent end of the Earth, obviously 'tis unacceptable. Here's a notion: "Got Gold?"
"As you've thrice stated, mmb..."
Right Squire. So many reasons to have some Gold. (By the way, your use of Middle English there is most impressive).
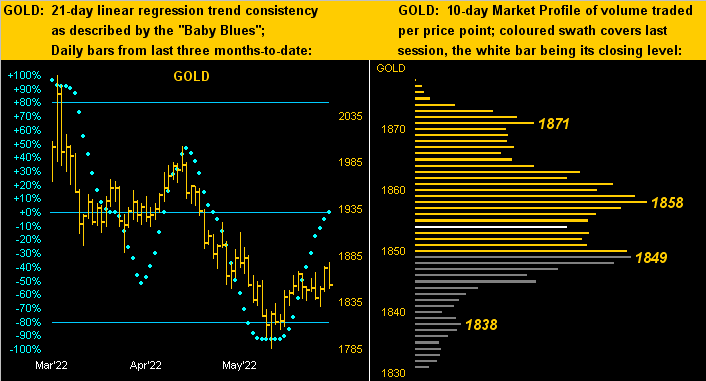
Not so impressive are Gold's rather directionless wanderings. Yet, neither are they depressive as price isn't recently really going down as we see here on the left in the panel of Gold's daily bars from three months ago-to-date. As for trend consistency, Gold's "Baby Blues" continue their upside move; but should price not soon materially get off the mat, the blue dots shall stall and we don't wish to see price then fall. As for the panel on the right of Gold's 10-day Market Profile, that's a pretty fat lot of volume concentration in the 1849-1858 zone:
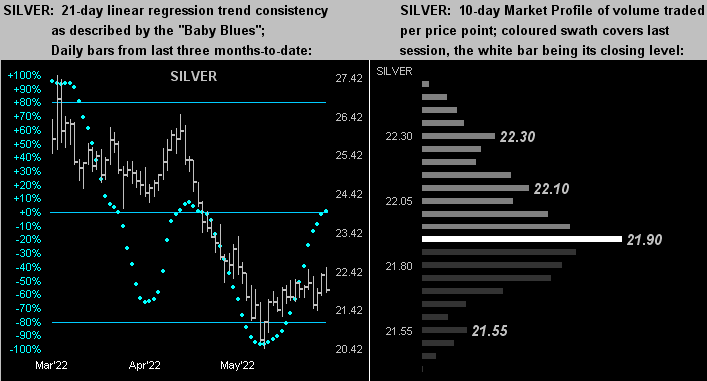
The same can be said of Sister Silver for both her Bars 'n Blues (below left) and Profile (below right), with price settling the week 'round the most heavily-traded level across the past fortnight of 21.90. As for the Gold/Silver ratio now being 84.5x, Silver put in sync with the ratio's millennium-to-date average of 66.7x places price +21% higher than today at 27.78. "Got Silver?"
To close, let's peek ahead at next week's incoming metrics for the Econ Baro. Which is to say, there's not that much at which to peek. Of the eight scheduled reports, the most watched is likely to be Friday's release of retail inflation, the May Consumer Price Index expected to have more than doubled its inflating from April's pace -- but because neither do you consume energy nor food -- the "Core" reading is anticipated to have slowed a bit. But don't be too slow to pick up some Gold; just ask The Queen!

Brava Brava Brava!
...m...

