- Is climate change real? If so, is it the result of burning dirty fossil fuels, or do government airplane “chemtrails” play the main role?
- What about gold? Price is often soft on Tuesdays, and some conspiracy buffs like the term, “Takedown Tuesday”. Is it possible that an evil cabal of banks is responsible for gold price reactions?
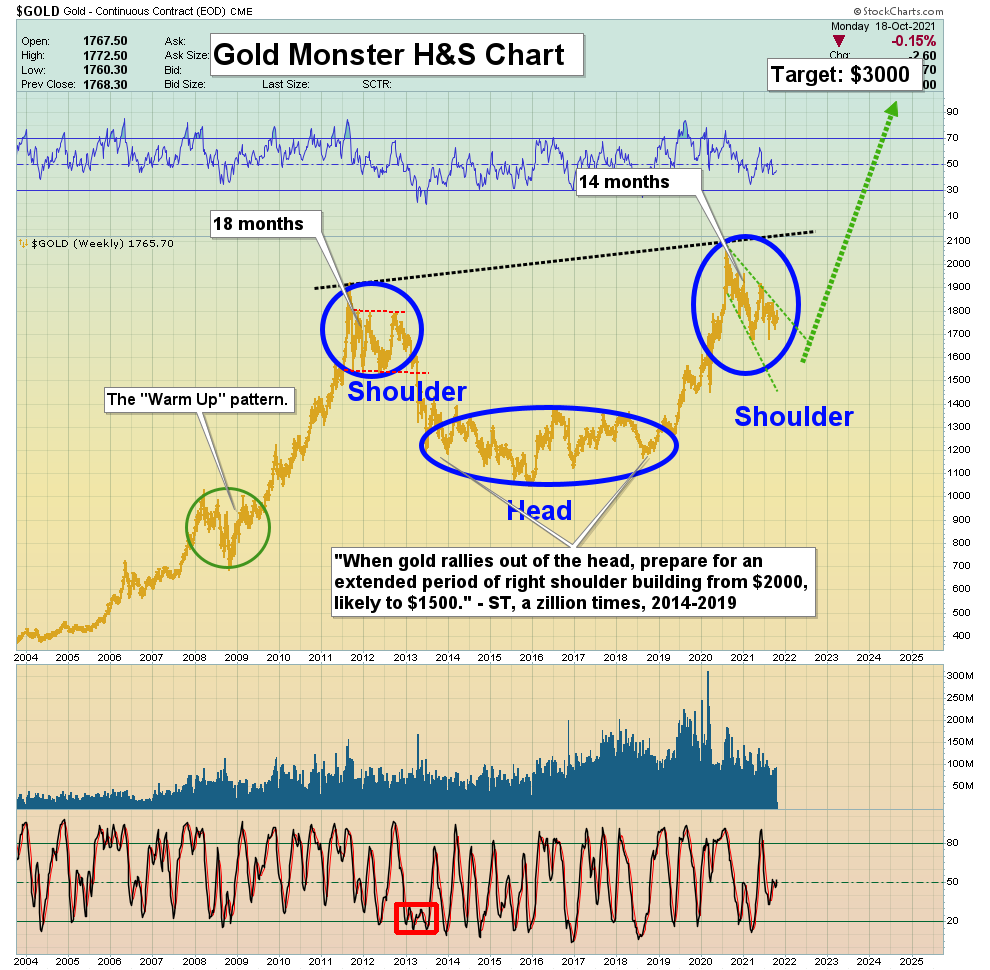
- The exact truth of these matters may be impossible to discern, but what should be obvious is that the big picture for gold is awesome!
 Double-click to enlarge this spectacular weekly gold chart.
 - It’s essentially impossible to predict the exact endpoint to the building process of a head or right shoulder in a gigantic inverse H&S bull continuation pattern.
- What can be said is that the rally from the head to the neckline is always enormous, and the wealth created by the rally from the right shoulder low to the math target of the pattern above the neckline… can be life changing for investors.
- Tactics? The key is to focus on the miners when these fabulous opportunities present themselves.
- On that note, please click here now: https://galacticupdates.com/wp-content/uploads/2021/10/2021oc19sil1.png Double-click to enlarge this SIL weekly chart. The target of this drifting rectangle is about $62.
- That’s an enormous gain from the current price area, but if gold pushes towards the H&S pattern target of $3000, SIL could trade at $100, $150, or even $200.
- Next, please click here now: https://galacticupdates.com/wp-content/uploads/2021/10/2021oc19jfun1.png Double-click to enlarge this GDXJ weekly chart.
- A breakout from the rectangle targets the $64 area highs, and to view an even more bullish scenario…
- Please click here now: https://galacticupdates.com/wp-content/uploads/2021/10/2021oc19j2.png Double-click to enlarge. It could be argued that the price action is not just a drifting rectangle but also an elongated bull flag.
- That would open the door to a surge to the $90 to $100 price area.
- Next, please click here now: https://galacticupdates.com/wp-content/uploads/2021/10/2021oc19gdx1.png Double-click to enlarge this incredibly bullish GDX chart. The bull wedge formation could also be a pennant that targets the $65 area all-time highs.
- Fundamentally, the relentless rise in Indian demand might be enough to drive gold to $3000. At the current pace, demand could reach the 150-180 tons/month marker in just two to three years.
- What about the fear trade for gold in the West? Well, please click here now: https://galacticupdates.com/wp-content/uploads/2021/10/2021oc18printedfun1.png Carl Icahn understands that money printing can create a stock market crash or “1970s gulag”…
- While gold, silver, and the mining stocks soar.
- I understand that many gold bugs get nervous when the stock market appears shaky, but I’ve suggested (relentlessly) that those fears can be discarded when the theme is inflation, as it is now.
- Also, my key 10,100 moving average signals for the 2hour “Q’s” chart (Nasdaq ETF) suggest the stock market could be poised to rally.
- To view that chart, please click here now: https://galacticupdates.com/wp-content/uploads/2021/10/2021oc19stkmkt1.png Double-click to enlarge. I’ve predicted that the US stock market will crash, but not until 2022, and this fresh buy signal on the Q’s bears witness to my prediction.
- Furthermore, money managers have yet to view inflation as “here to stay”, let alone “out of control”. Once that happens and does so while the government pressures the Fed not to raise its borrowing costs… that’s when an institutional investor stampede out of the stock market and into gold becomes the main theme in play.
- Next, please click here now: https://galacticupdates.com/wp-content/uploads/2021/10/2021oc19goau1.png Double-click to enlarge what is probably the world’s best-looking metals ETF chart. It’s GOAU, and there’s a magnificent wedge formation that is accompanied by a very bullish volume pattern.
- An upside breakout appears imminent, and it should be awesome! Note the red GOAU sell signal in the summer of 2020. That signal was defined by the arrival of gold at round number $2000 and the huge inverse H&S pattern neckline.
- The blue buy signal for GOAU is defined by right shoulder time symmetry with the left shoulder on the gold bullion chart. It’s a signal for gold bugs of the world… to prepare to feel very happy, while getting much richer!
Thanks!
Cheers
St

