- “Expect the unexpected.” – Financial and economic crash expert Jeremy Grantham, April 7, 2023.
- Please click here now. Jeremy argues that America is in a super bubble… and the nation’s workers are being ruined by stockholders who push corporate boards to funnel profits into buybacks rather than business expansion.
- His solution? His horrifying solution is more regulation instead of replacing the nation’s fiat with gold!
- The root cause of US street crime, loose morals, government meddling, and the loss of regular citizen purchasing power is highly correlated to the use of government fiat money. Fiat is the money of debtors. Gold is the money of kings. A debtor is tempted to live above their means and can resort to the use of immoral tactics to maintain their lifestyle… rather than engage in personal sacrifice to pay all that is owed. In a nutshell:
- America’s raw fiat sewage outhouse doesn’t need regulators or audits. It needs to be shut down.
- Please click here now. Whether the US economy is in a super bubble or not is debatable, but what can be said is that (basis the CAPE ratio) the stock market has been in a disturbing state of general overvaluation since 1995.
- The American empire is in its ending stage and by denying it, the nation’s leaders and their bootlickers are making the finale quite volatile. Violence is a becoming a theme of concern.
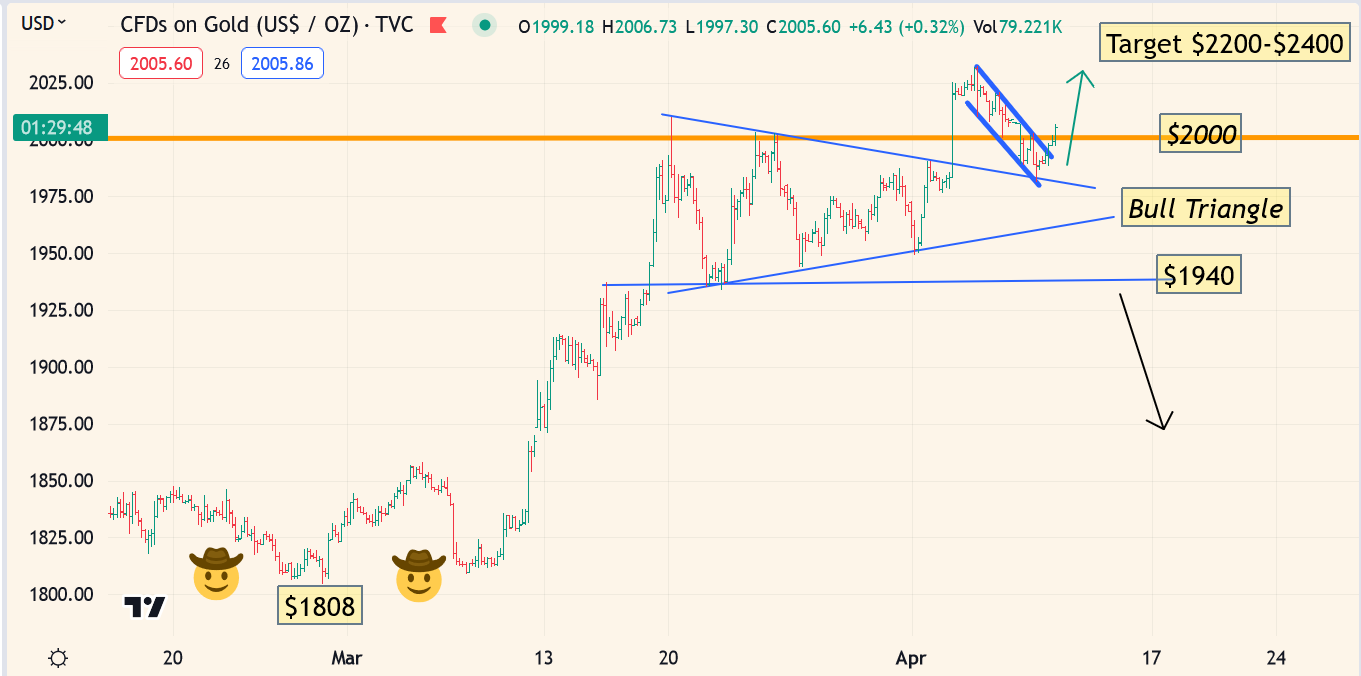
 Click to enlarge. As noted, gold is the currency of kings (and regular citizen champions). Here in the ending stage of the empire, price resiliency is notable on this short-term chart.
- The pullback to the small but aesthetic triangle pattern may already be over.
- The short-term target is about $2050, but a key long-term chart suggests gold could reach $2200-$2400 before there’s a major reaction.
- For a look at that chart, please click here now. Double-click to enlarge. A large rectangle has been in play for several years. It targets the $2400 zone, and arguably $2500-$2600. Breakouts are usually followed by pullbacks and a pullback that occurs after an initial rally to about $2200 seems reasonable.
- Note the red and blue dots on the chart. They showcase all the buy and sell signals I’ve issued for long-term investors over the past five years. The average is about two buy signals and two sell signals per year.
- These signals are not for aggressive traders but for gold portfolio “gardeners”. Lawns need to be mowed and trees need to be trimmed. It’s simple care and maintenance.
- What should also be noted is that all these round-trip signals are winners. Patience is the key to this success.
- While gold, silver, and mining stocks are theoretically easy to buy and sell successfully, the emotions of greed that overwhelm investors are much stronger than for other markets. Even investors with incredible intestinal fortitude can be emotionally swayed… they end up selling when they should be buying, and vice-versa.
- Hence the mantra, “There’s no fever like gold fever!”
- Inflation, the 2021-2025 war cycle, a wildly overvalued stock market, and empire transition dominate the investing landscape. I cover the big picture 5-6 times a week in my flagship Galactic Updates newsletter. At $199/year, investors feel the price is too low, and I’m doing a $179/15mths special offer that investors can use this week to get in on the action. Click this link to get the offer or send me an email and I’ll get you a payment link. Thanks!
- Next, please click here now. Double-click to enlarge this important “Quaich” chart. Unlike a regular cup and handle pattern, the Quaich has two handles. It’s like an inverse H&S bull continuation pattern, but the “neckline” of the pattern is drawn from the peaks of the handles.
- The good news is that this one has a $3000 target… and the pattern is so big that numbers like $5000 and $6000 need to be considered as legitimate projections.
- Clearly, the US government’s comical bungling of empire transition (to China & India) is a big factor in determining how high gold ultimately goes. The more the transition is bungled, the higher gold will go.
- Please click here now. Double-click to enlarge this vital GDX versus gold chart. There’s a huge base pattern, with a breakout likely around the year 2025. The chart may be implying that when the current 2021-2025 war cycle ends in 2025, stagflation will become the dominant theme, and gold stocks will be the asset of choice for most of America’s money managers.
- Jeremy Grantham is 100% correct that Main Street America has been throttled by greedy stock market investors and a fiat Fed soup kitchen that enables their greed and the relentless destruction of the purchasing power of innocent citizens.
- His “more regulation for a corrupt fiat system” solution is a temporary bandage at best, and ultimately nonsensical. Here’s the bottom line: US stock market investors will be judged by the free market, found guilty, and sentenced to serve decades of time in what may become the ultimate stock market gulag.
- Please click here now. Double-click to enlarge this weekly GDX chart, then please click here now. Double-click to enlarge. Clearly, gold stock investors have nothing to fear, and a lot to cheer! The inverse H&S pattern targets the 2020 highs of $44, and a breakout from the amber channel targets a price of about $53. Gold and silver stock investors have deserved much higher prices for a long time. The waiting is over and now it’s time to let the good times roll!
Thanks!
Cheers
St

