When the gold price declines or doesn’t go up according to expectations, analysts and investors begin looking for explanations. As the price drops further, claims are made that gold is undervalued.
Gold is not undervalued; and we might see further, larger price declines very soon.
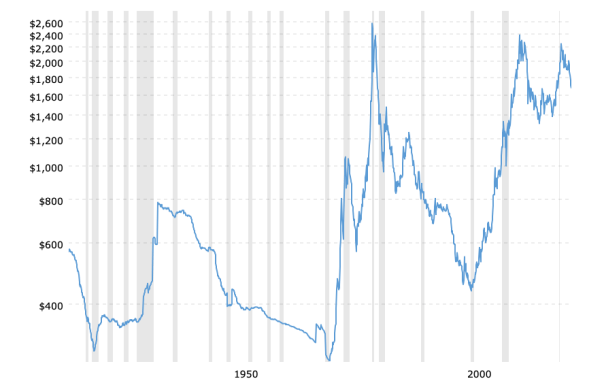
Below is a long-term chart of gold prices adjusted for inflation…
Gold Prices (inflation-adjusted) – 100 Year Historical Chart
There are three distinct peaks (1980, 2011, 2020) on the chart above. Each of the three peaks indicate the point where gold prices reflected the accumulated loss in purchasing power of the U.S. dollar up to that point in time.
For example, the monthly average closing price for gold in February 1980 (first peak on the chart) was $677 oz. At that time, the U.S. dollar had lost two-thirds (67%) of its purchasing power over the previous six decades.
Then, in October 2011, the monthly average gold price peaked at $1722 oz. By then, the U.S. dollar had lost purchasing power totaling almost ninety-nine (98.8) percent.
The third price peak for gold was in July 2020 at $1971 oz. The intraday high of $2058 reflected a full ninety-nine percent decline in U.S. dollar purchasing power.
GOLD AND U.S. DOLLAR
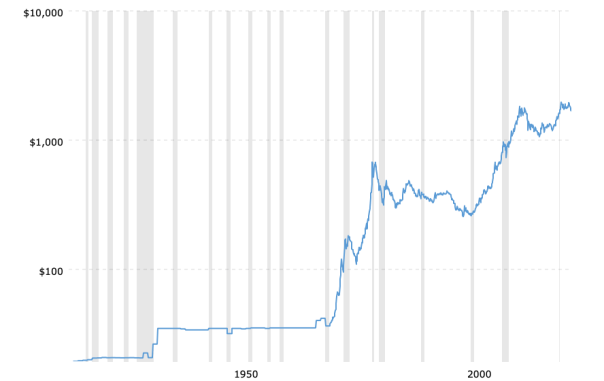
The nominal price of gold has trended higher in concert with the decline in U.S. dollar value. See the chart below…
Gold Prices – 100 Year Historical Chart
As long as gold is priced in dollars, and as long as the dollar declines in value (i.e., loses purchasing power), the price of gold will continue to reflect that loss in purchasing power – over time.
A continually higher gold price, however, does not mean that gold is gaining in value.
VALUE OF GOLD
Gold’s value is in its use as money – real money. That value is constant and unchanging.
The three price peaks on the first chart are telling us that no matter how high the gold price goes, it will not exceed those peaks in inflation-adjusted terms.
What you can buy with an ounce of gold at $1700 oz. today is the equivalent of what you could buy with an ounce of gold at $677 oz. in 1980; or what you could buy with an ounce of gold at $20 oz. a hundred years ago. (see Gold at $2000 or $600? – No Difference)
Gold’s price in U.S. dollars tells us nothing about gold. A higher gold price over time tell us only one thing: the extent to which the U.S. dollar has lost purchasing power.
IS GOLD UNDERPRICED?
When compared to the monthly average price peak in July 2020 of $1971 oz., the current gold price of $1675 oz. is cheaper by approximately three hundred dollars.
However, the previous peak price of $1971 oz. is now $2253 oz. in inflation-adjusted dollars. Therefore, the current gold price of $1675 oz. is cheaper by closer to six hundred dollars compared to July 2020 ($2253 – $1675 = $578).
So, yes, it is possible to argue that gold is currently underpriced; but, if you think that means that gold is a bargain, think again.
After its intraday price peak at $843 oz. in January 1980, the gold price dropped to a low of $285 oz. in February 1985. Many believed at the time that gold was severely underpriced. Unfortunately, it was more than fourteen years later before gold marked its absolute low price of $258 oz. in 1999.
THREAT OF DEFLATION
It is quite possible that the gold price will continue dropping due to the risk of credit collapse and the possibility deflation (see Effect Of Deflation On the Gold Price). To a lesser extent, any moderation in the effects of inflation and continued strength in the U.S. dollar will not be favorable for a higher gold price.
CONCLUSION
The U.S. dollar is very strong and getting stronger; expect lower gold prices to continue for now. If you are technically oriented, there is no appreciable support until somewhere between $1400-1500 oz. (see Gold Charts – $1450)
The effects of inflation are unpredictable. Keep your eye on the dollar and don’t be swayed by the allure of bargain prices.
Kelsey Williams is the author of two books: INFLATION, WHAT IT IS, WHAT IT ISN’T, AND WHO’S RESPONSIBLE FOR IT and ALL HAIL THE FED!


