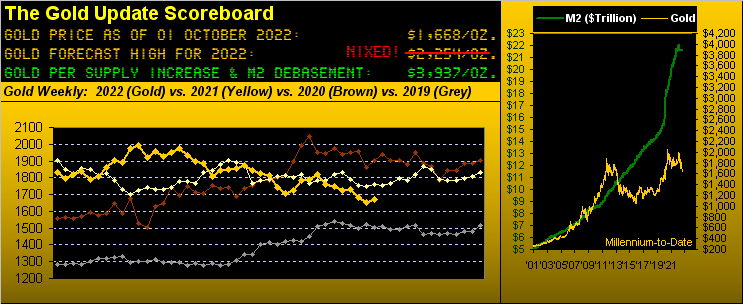
With Q3 officially in the books, and as mused these last two weeks, we've now beached our Gold forecast high for this year of 2254, just as we did a year ago at this time for the even higher level of 2401.
Not that 'tis impossible for Gold to still reach 2254 with three months to go in 2022. By settling this past week yesterday (Friday) at 1668, to reach 2254 by year-end is requisite of a +35.1% price increase within the next 63 trading days. 'Course you sharp-eyed Gold followers already know that century-to-date, Gold has historically twice risen that much within three months during both 2006 and from 2008 into 2009. But given that it has been the "in" thing for essentially a decade now to consider Gold as "out", let's look toward next year for whatever forecast we'll surmise come this year-end.
As for the at-large ongoing Gold disinterest even as this Investing Age of Stoopid unravels, such neglect for the yellow metal shows ever so stark here in the following table of Gold's receding average monthly contract volume traded at the COMEX for the past three years-to-date. Clearly you can see that monthly trading volume is in abject decline, indeed so much so that its average monthly level through these first nine months of 2022 is but 60% of what 'twas just three years ago in 2019:

Further from the "Fun With Numbers Dept.", at that linearly-regressed declining rate of monthly volume, come 2027: there shan't be any. They'll simply display old relic Gold in an impenetrable glass case at the Smithsonian with a descriptive panel declaring bits**t as actually having been the world's true currency throughout. Even children's books shall be written about the ancient Egyptians having used bits**t to purchase their Pyramids from Paris.
Regardless of pending revisionist history, given our failure to correctly forecast Gold's high for a second straight year, where did we err? After all, by currency debasement alone, Gold's valuation today per the opening Scoreboard is 3937, making our 2254 prognostication most modest.
So in hindsight having thoroughly thought this through, clearly the sole analytic barrier blocking the opportunity to have been right about at least 2254 this year, (let alone 2401 last year) was our not having established a price-rise points mitigant to allow for the purported -- if not outright verified -- Manipulation of price suppression by (as we oft describe them) the "M word" crowd.
For otherwise: we've oft provenly demonstrated that Gold broadly plays no currency favourites, thus debunking the "Dollar Strength" crowd. Also, we've oft provenly depicted Gold's ability to soar in times of rising interest rates, thus debunking the "Fed is Everything" crowd. Maybe as Stoopid comes to his/her senses that earningless "meme" stocks are worthless, they'll think about getting some Gold. (And our day to sell Gold shall be that when everyone else wants to buy Gold -- you know -- somewhere up there in the five-figure range).
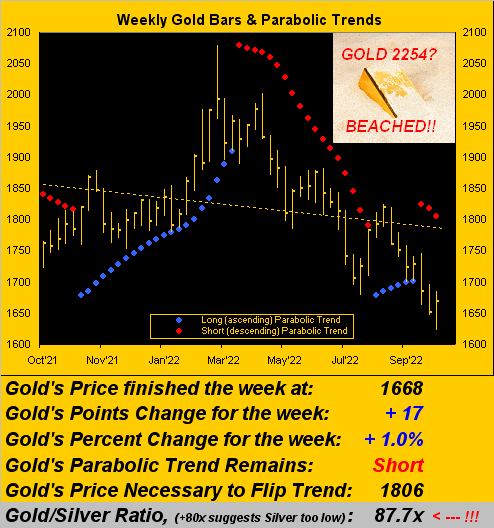
But the low four-figure range is where Gold continues to makes its home as we turn to the weekly bars from one year ago-to-date. And having beached this year's call for 2254, Gold's red-dotted parabolic Short trend continues to descend, as also slopes the full year diagonal regression trendline. Beached indeed is poor old Gold! Bear in mind as detailed in recent missives that -- purely in the technical "no common sense" vacuum -- the upper 1500s are Gold's destination on this current parabolic run, (barring fundamentals coming to the fore):
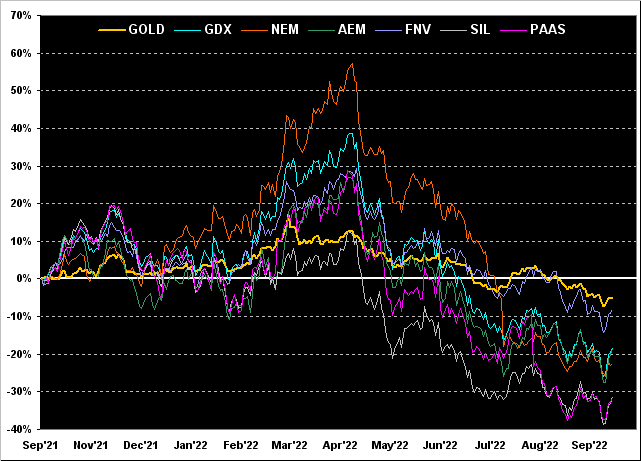
For the same year-over-year stint, it being month-end, here next we've Gold's evolving percentage track now -5% along with those for such high-level equity notables, namely: Franco-Nevada (FNV) -8%, the VanEck Vectors Gold Miners exchange-traded fund (GDX) -18%, Agnico Eagle Mines (AEM) -19%, Newmont (NEM) -23%, the Global X Silver Miners exchange-traded fund (SIL) -31%, and Pan American Silver (PAAS) -32%. "Brutal" was how we described it a month ago, and so it remains, one living with the equities’ leverage as well as dying with it:
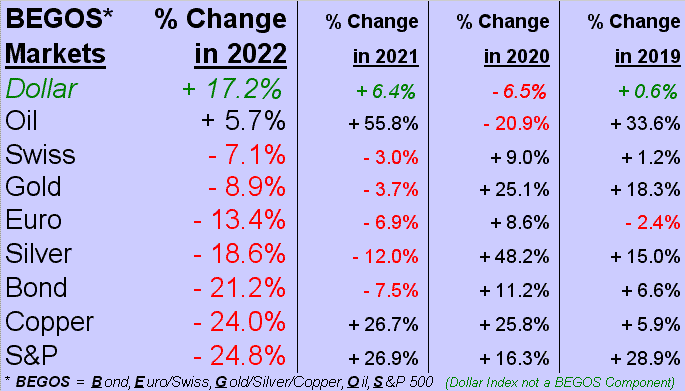
The Gold forecast thus beached, our S&P 500 target of 3600 was nonetheless reached at precisely 10 minutes before closing out Q3 yesterday, the mighty Index settling at 3586. So as we next go below to our BEGOS Markets standings year-to-date, the new cellar dweller is the still (by honest earnings valuation) overly-bloated S&P. The best of the BEGOS bunch and the sole component still clinging to growth year-to-date is Oil. Of course topping the whole heap is the Dollar Index (which is not a BEGOS Market, but is included for the purpose of perspective), the Buck leading not only the Ugly Dog Currencies Contest, but the entirety of this overall group as the "over-valuation of everything bubble" deflates, a phenomena from which Gold and Silver rightly ought themselves extricate:
And as well-noted, specific to the S&P, its technical support structure runs from here down to 3200. Moreover, even as still very expensive as the S&P is here at 3586 given the "live" price/earnings ratio of 32.4x, the Index is severely oversold near-term. Thus if this 3600-3200 support zone be viewed as a mattress, we anticipate the S&P -- rather than continuing to nosedive -- to begin a period of bouncing about a bit, should the trading-dominant technically-guided algorithms have their way. 'Course as the S&P by earnings "ought" drop another -1,000 points (some -30%) from here just to revert to the P/E's mean (which historically has always happened), maybe Gold can get a bid. Why even Goldman Sachs (having called for S&P 3600 four months after we herein anticipated same) sees still bleaker days ahead for StateSide stocks.
Either way, October shan't be boring. Whilst September carries the moniker of "worst month annually" for the S&P, the month of October across the past 50 years ranks as the most volatile, its average low-to-high or high-to-low swing being 9.0%; (January ranks a distant second at 7.2%, and June the least volatile at 5.5%; all that just in case you're enjoying scoring at home). The point is: should October's S&P swing directionally down by the average of 9.0%, 'twill be near to the bottom of the "mattress" 'round 3200. Fundamentals ignored (a bad idea), we'll probably see the S&P all over the place as October unfolds, along with Q3 Earnings Season. Or as the saying goes: "Get in, fasten your belt, shut up and hang on!"
As for the Economic Barometer, 'tis been actually hanging on reasonably well of late, and perhaps sufficiently so that come 27 October's release of Q3 Gross Domestic Product we'll see a positive number. 'Course as we've described in the past, the Econ Baro is not so much an Index as 'tis an oscillator. That means it has a wont to rise as "things get worse more slowly"
And despite the Baro putting in an on-balance positive week (as we'd suggested it would in last week's missive), there were some stinkers in the metrics: September's Chicago Purchasing Managers' Index thudded below the key 50 economic contraction borderline for the first time since COVID kicked in during March of 2020, even as the Conference Board's read on Consumer Confidence reached its highest level since February. Too, August's Pending Home Sales shrank at four times the percentage pullback expected (-2.0% vs. -0.5%). Home prices and mortgages getting too dear? The Federal Reserve's favoured gauge of inflation -- Core Personal Consumption Expenditures -- leapt from flat for July (0.0% annualized) to +0.6% for August (+7.2% annualized). Thus higher rates await: FedFunds are currently set at 3.00%-to-3.25%, however the FedFundFutures settled yesterday at 4.03% ahead of the 02 November Policy Statement. "Let's hit 'em again!" And the Baro's building ground may justify that:
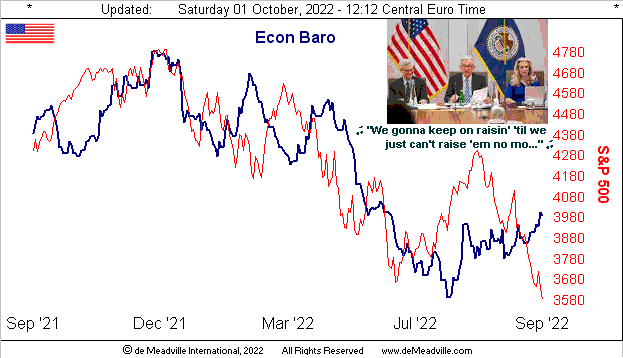
Indeed this past week, Dow Jones Newswires queried: "Why Are Companies Still Hiring When GDP Is Shrinking?" Someone might kindly refer DJN to the Econ Baro's up-track these last few months. That said, CNN gave us our "Chuckle of the Week" suggesting that the Fed's raising of rates "could land the US economy in a recession". Where were they through at least the first six months of this year?
Either way, Boston FedPrez Susan "Oh Suzanna!" Collins and Minneapolis FedPrez Neel "Cash is King!" Kashkari both stated the Fed need maintain its rate rises to counter inflation. Bottom Line? The U.S. may blip up out of recession for a quarter or two, and then fall back thereto. For as goes Mexico (which we read is occupying more and more of the United States) and the Banco de México having just raised rates for an eleventh straight time, so perhaps goes the Fed. See how all of this works together? 'Tis a beautiful thing.
Meanwhile in jolly old England, the pound sterling -- which a year or so following Nixon's nixing of the Gold Standard in 1971 cost some $2.50 -- nearly reached down to one-to-one (into the $1.03s) this past Monday. And if you think that's pounding down the pound, try this: in 1972, for one pound sterling you could receive about 11 Swiss Francs; today against the world's mightiest (albeit now fiat) currency, one pound gets you one Swiss Franc. Or Gold-wise, an ounce of Gold (a real currency) in '72 would fetch you 10 Swiss Francs. Today 'twill fetch you 1,630 Swiss Francs, an increase of 16,200%. (Pssst: "Got Gold?")
Elsewhere, as for the ever-emboldened World Bank, they've just materially reduced their economic outlook for China. We'll see how that ultimately affects inventories at Walmart (WMT).
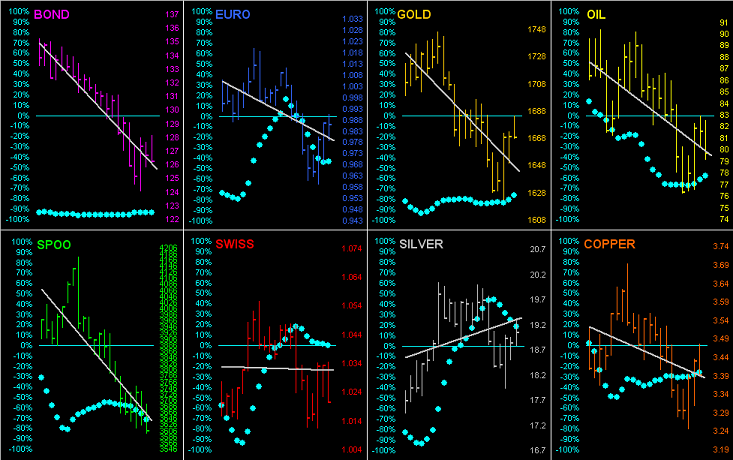
So effectively with "everything" being sold, next let's go 'round the horn for our eight BEGOS Markets by the day from a month ago-to-date. And with Silver the sole exception, the grey diagonal regression line for each component is negative, although those with the rising baby blue dots of consistency are, well, "bucking" (pun intended) the trend to some extent, and that includes Gold:
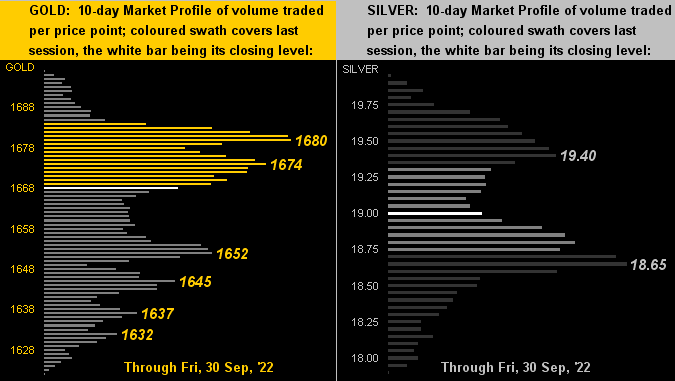
Next we've the precious metals' 10-day Market Profiles for Gold on the left and for Silver on the right. Certainly a better picture than as posted a week ago, the longest bars having established levels of trading support and resistance:
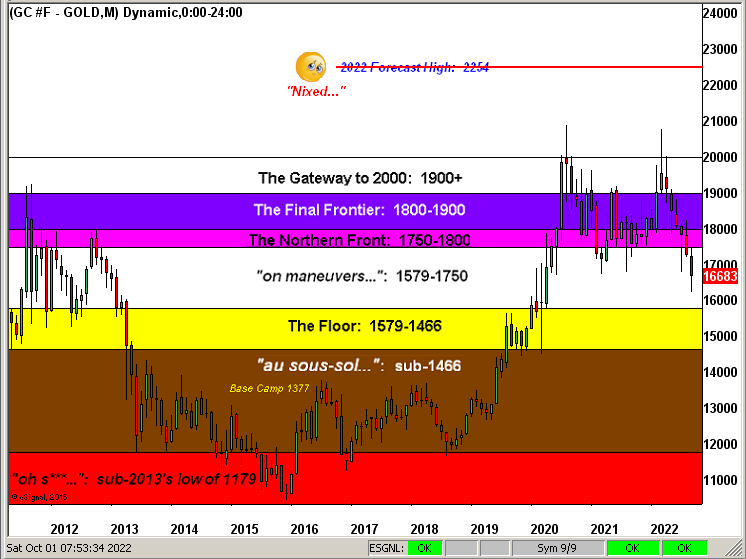
Finally, it wouldn't be month-end without the ever-struggling Gold Structure chart by its monthly candles across the past 11 years, now featuring our nixed forecast for 2254. Indeed for September alone (the rightmost monthly candle), it completely retreated from The Northern Front. Nothing is easy:
In sum, our Gold forecast for it to reach 2254 this year is beached, (dare we say drowned): waiting purely in the technical wings for price are the upper 1500s, (but let's not go there). Yet the S&P 500 has finally reached down to our long-anticipated 3600-3200 support zone: as to how far it penetrates therein 'tis  "Too soon to tell..."
 --[Bonnie Raitt, '89]. And for the Econ Baro, next week looks to be mixed, highlighted (or low-lighted) by a reduction in September's Non-Farm Payrolls along with an up-tick in the Unemployment Rate. But relax: best to employ oneself in getting some Gold!

Cheers!
...m...

