We think we know most (if not, all) of what we need to know about gold. Investors do their research and marketers spin their best yarn(s). Support is offered with an amazing array of fundamental and technical factors on display for all to see. But what are we not seeing?
NORMALCY BIAS DEFINITION
normalcy bias (noun)
“The phenomenon of disbelieving one’s situation when faced with grave and imminent danger and/or catastrophe.” …Wictionary
Here is a better, more complete definition from a different source…
“The normalcy bias, or normality bias, refers to a mental state people enter when facing a disaster. It causes people to underestimate both the possibility of a disaster occurring and its possible effects. This often results in situations where people fail to adequately prepare for a disaster, and on a larger scale, the failure of governments to include the populace in its disaster preparations. The assumption that is made in the case of the normalcy bias is that since a disaster never has occurred then it never will occur. It also results in the inability of people to cope with a disaster once it occurs. People with a normalcy bias have difficulties reacting to something they have not experienced before. People also tend to interpret warnings in the most optimistic way possible, seizing on any ambiguities to infer a less serious situation.”
The bold emphasis is mine; for good reason and with real intent. Investors and others plan for the future based on what they know, or are used to. On a day-to-day basis, most of us think and act according to what has happened most recently, and usually with a positive bias.
That is reasonable and expected. The problem is that when something bigger and hugely negative shows itself, we tend to ignore it or explain it away. There is historical precedent for that.
NORMALCY BIAS – PAST AND PRESENT
The best example from the past is the The Great Depression. The warning signs were there: a decline in economic activity that started before the stock market crash; trouble in Europe and other parts of the world; a sense of fear and anxiety associated with the stock market, especially when significant drops occurred.
Regardless, investors acted as though everything were fine, or simply ignored the indicators. They were encouraged to buy stocks using borrowed money, and did so with reckless abandon. Confidence in the proclamations of ‘experts’ that everything would be fine, they marched towards the Big “D” seemingly unaware of the gravity of the situation they faced – and totally unprepared.
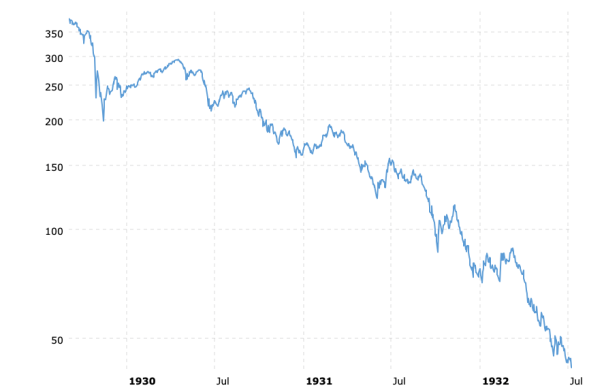
The chart below shows the calamitous drop in the Dow Jones Industrial Average that occurred between August 1929 and August 1932…
Dow Jones – 1929 Crash and Bear Market
 \
\
During those three years the stock market, as reflected by the Dow Jones Industrial Average, lost nearly ninety percent of its pre-crash value. When you look at the chart, you might wonder how it could have happened so quickly and why investors were shocked so horribly, both financially and emotionally.
We get a possible indication of how the normalcy bias might have affected investors when we view the following chart…
Dow Jones – DJIA – 1915-1933
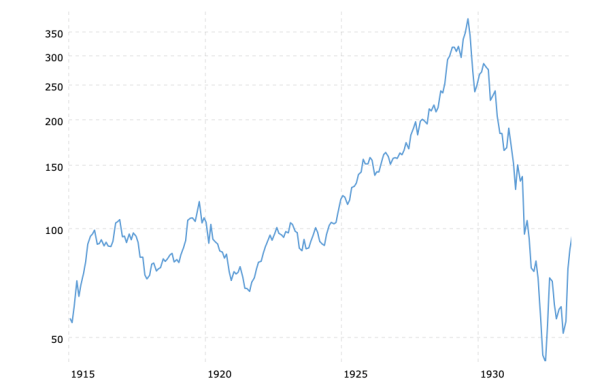
As seen in the chart, for eight years between 1921 and 1929 (The Roaring Twenties), the stock market advanced more than five fold. The Dow Jones Industrial Average rose nearly non-stop from 68 to 380.
What would cause people to be looking for anything so radically different from what they had experienced for most of the previous decade?
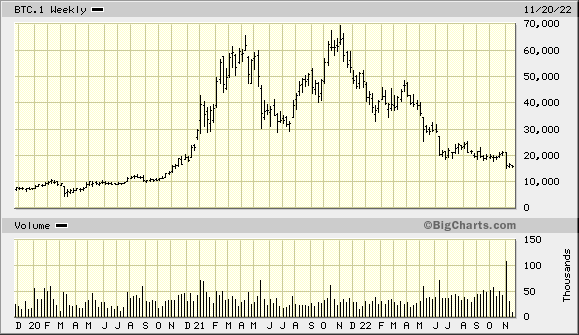
Recently (the present) investors in cryptocurrencies were blindsided by a series of events that seemed unimaginable to them a year ago. Again, it was more a case of ignoring the warnings or seeing them “in the most optimistic way possible”. See the chart (source) below…
Bitcoin – 1 Year
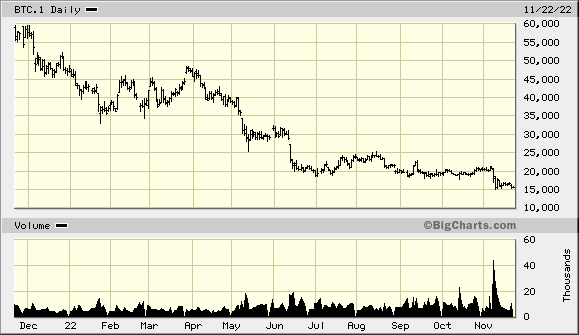
The U.S. dollar price of Bitcoin has dropped nearly eighty percent in barely more than one year. Here is a chart which shows Bitcoin price action prior to that huge decline…
Bitcoin – 3 Years
|
|
Somewhat similar to stocks, although much more explosively and in short order, the price of Bitcoin rose seven-fold just prior to its collapse. Do you think investors underestimated “both the possibility of a disaster occurring and its possible effects”? (see Is $100,000 Bitcoin Possible?)
GOLD AND THE NORMALCY BIAS
As far as the future is concerned, gold investors today are doing something similar to that which is pointed out in the examples above. With gold, one might think that since a disaster never has occurred then it never will occur. By disaster, as far as gold is concerned, we mean specifically a collapse in the U.S. dollar price.
But such a disaster has occurred before. See the chart below…
Gold Prices – 1980-2000
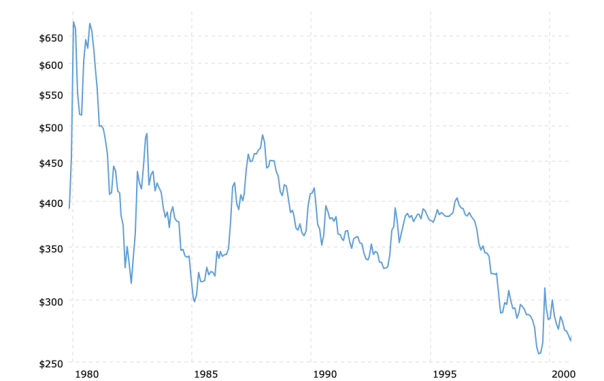
The decline in the gold price pictured above amounted to seventy percent and lasted for twenty years. As with stocks and Bitcoin, the huge decline was preceded by a multi-fold increase which is pictured in the chart below…
Gold Prices – 1968-1980
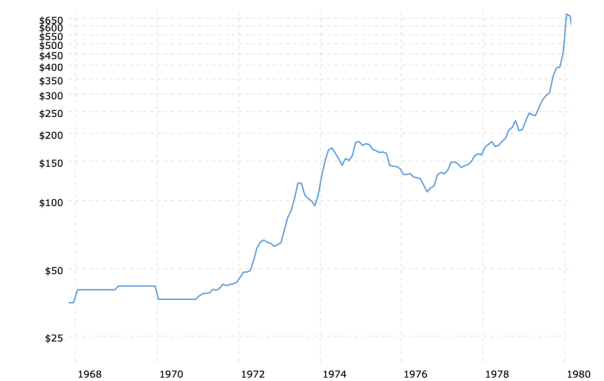
The increase in the gold price between 1968 and 1980 was several times larger than the increases in stocks and Bitcoin from the previous examples. For gold, the price increase was twenty-four fold, from $35 oz. to $850 oz.
Today, gold investors are acting very much as if the normalcy bias is in effect. Independent of unrealistic expectations for higher prices, they cannot seem to accept the possibility that gold prices can decline in large measure and for long periods of time.
They underestimate the possibility of a disaster occurring and are unprepared for it. It is quite possible for the gold price to drop further and for the decline to last longer. The size of the drop and the length of the decline could be much worse than imagined.
Then, the elements of surprise and shock will result from the tendency of investors to interpret warnings in the most optimistic way possible, seizing on any ambiguities to infer a less serious situation.” (also see Is $600 Gold Possible?)
Kelsey Williams is the author of two books: INFLATION, WHAT IT IS, WHAT IT ISN’T, AND WHO’S RESPONSIBLE FOR IT and ALL HAIL THE FED!


