China Is Leading the Dance in the Gold Market
Exceptional strong gold demand from both the Chinese central bank and private sector has been driving up the gold price over the past two years, by which they have taken over control over the gold price from the West. The People’s Bank of China (PBoC) bought a record 735 tonnes of gold in 2023, of which about two thirds were purchased covertly. In addition, the private sector net imported 1,411 tonnes in 2023, and a whopping 228 tonnes just in January of 2024. If the West joins the Chinese gold buying craze, in fear of rate cuts and currency debasement, it will be a perfect storm for gold.
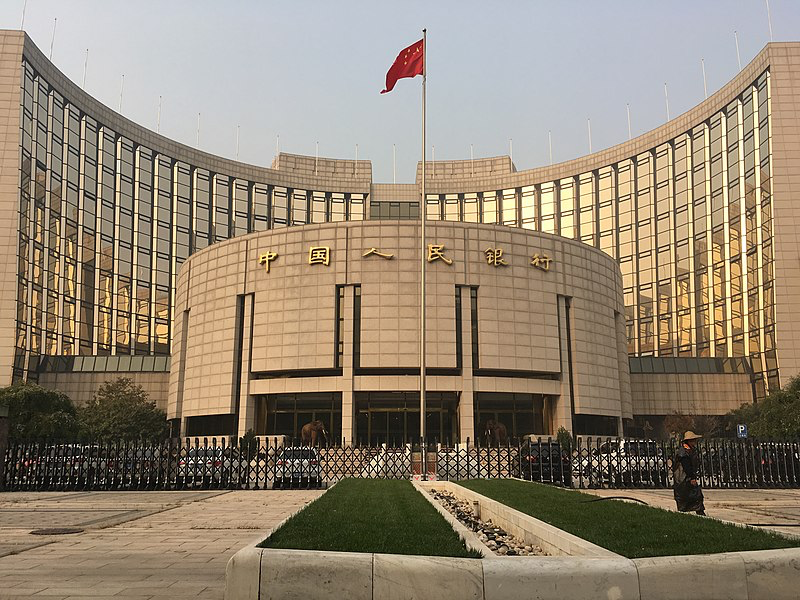
People's Bank of China headquarters in Beijing. Image via Wikimedia Commons user Max12Max, CC BY-SA 4.0.
The PBoC on an Unprecedented Gold Buying Spree
As most readers will be aware of by now, since the war in Ukraine, which led Western authorities to freeze dollar assets of the Russian central bank, estimated gold purchases by central banks as disclosed by the World Gold Council (WGC) have exploded. Covert PBoC gold purchases can be computed by comparing the WGC’s data with what is officially reported by central banks.
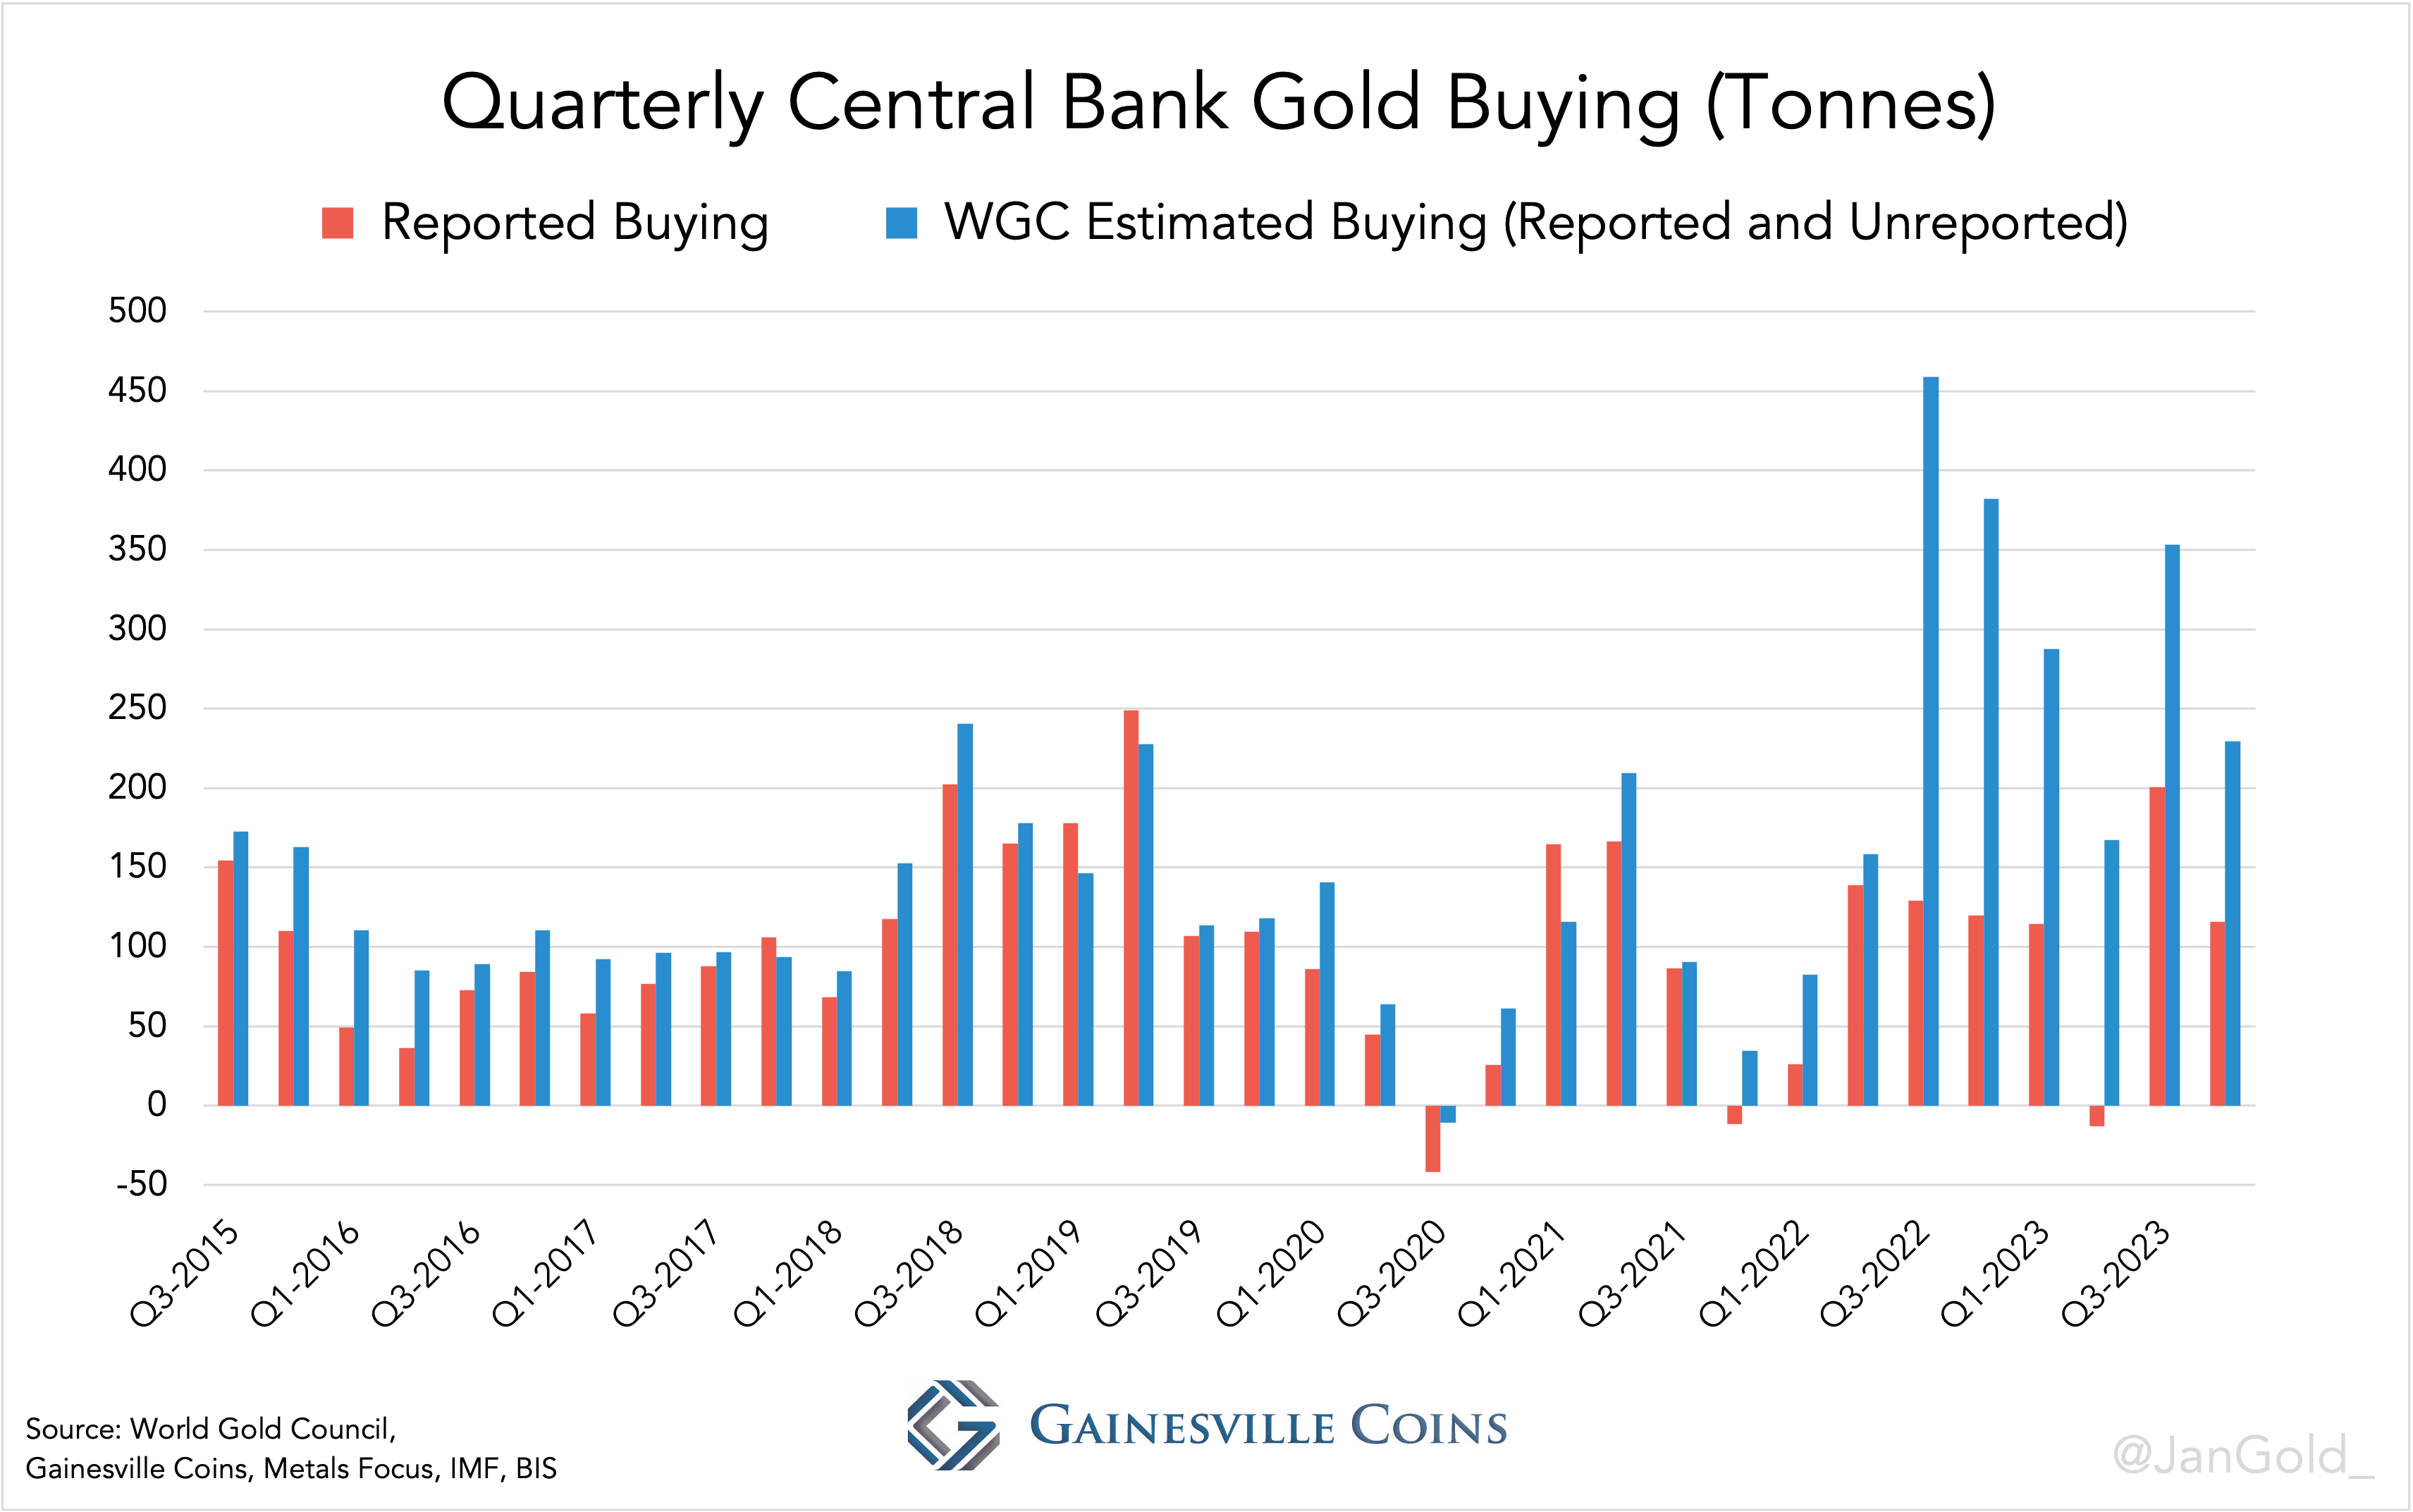
Quarterly reported and unreported central bank gold buying. Data up till Q4 2023.
The difference between WGC’s estimated buying and reported buying, arising from the fact that the WGC’s numbers are based on field research, is “largely” created by the PBoC, two industry insiders shared with me.
To compute what the PBoC secretly acquires every quarter I take eighty percent of total unreported purchases. Then, I add what the Chinese central bank reports to have bought. In total, over 2023, the PBoC bought a record 735 tonnes, up 23% from the previous record in 2022 at 597 tonnes.
My estimate is that the PBoC now holds 5,358 tonnes, which is 3,108 tonnes north of what’s officially disclosed at 2,250 tonnes (for more details click here).
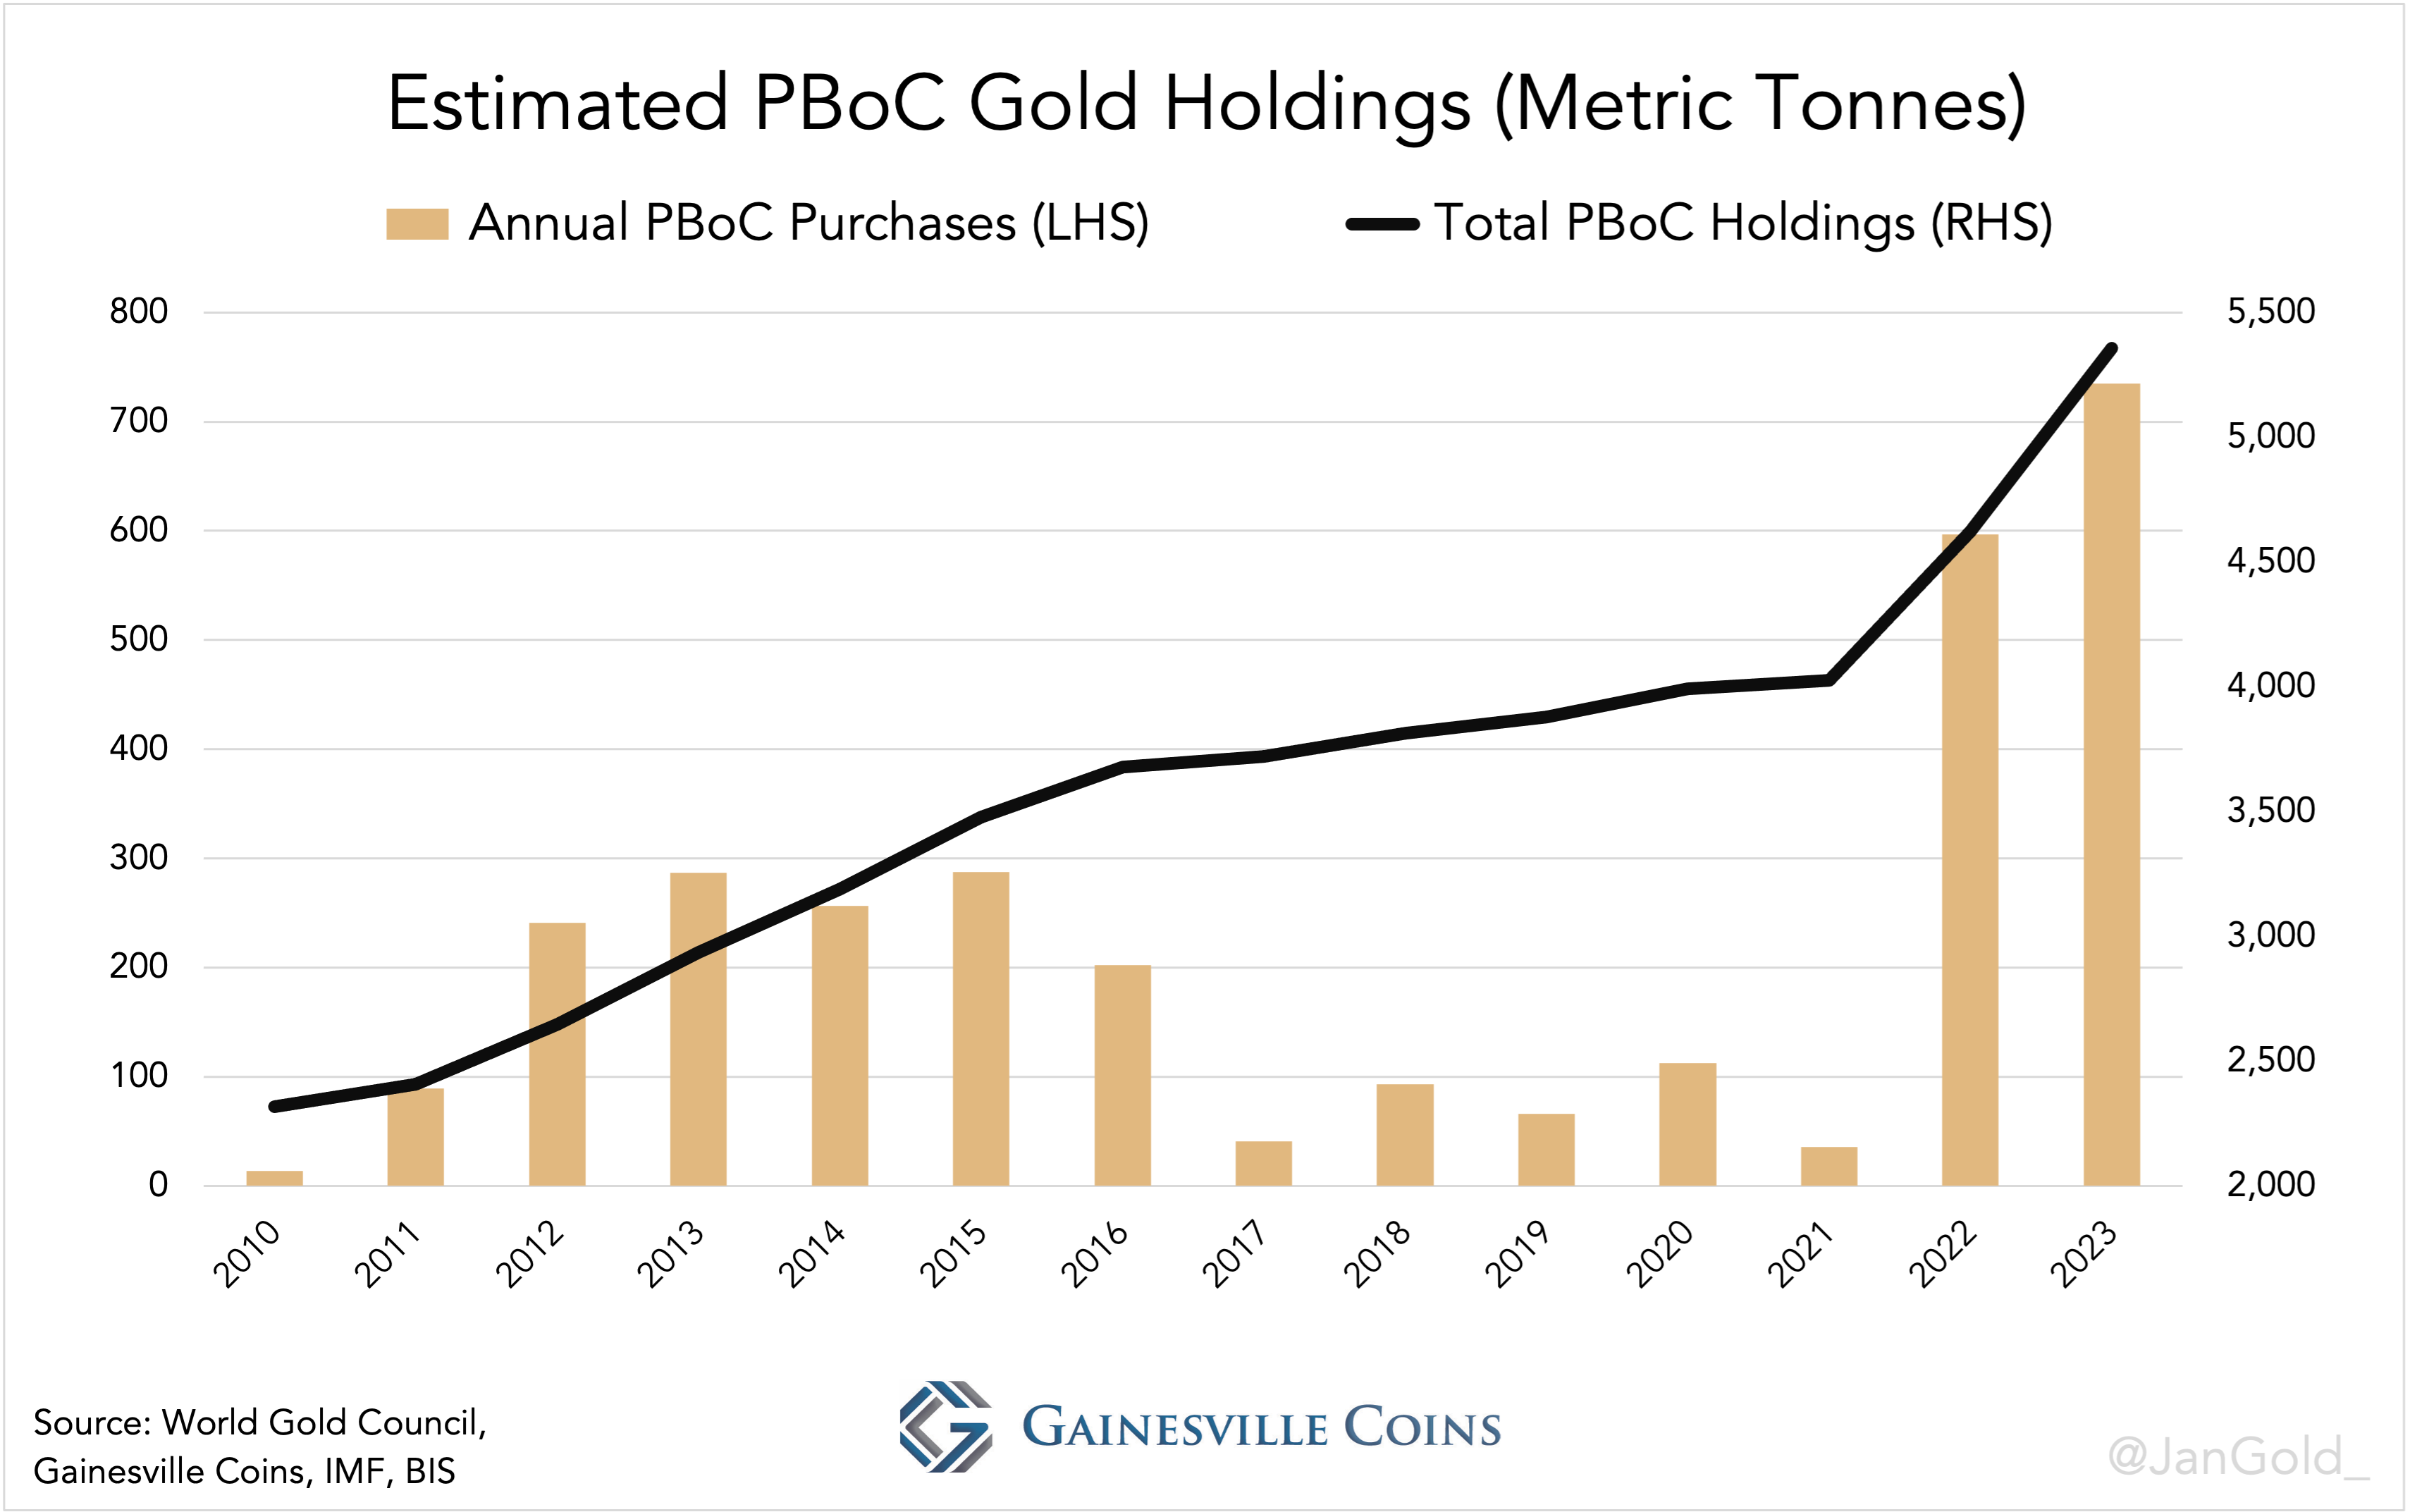
Estimated annual PBoC gold buying and total holdings. The Chinese central bank is buying gold like never before.
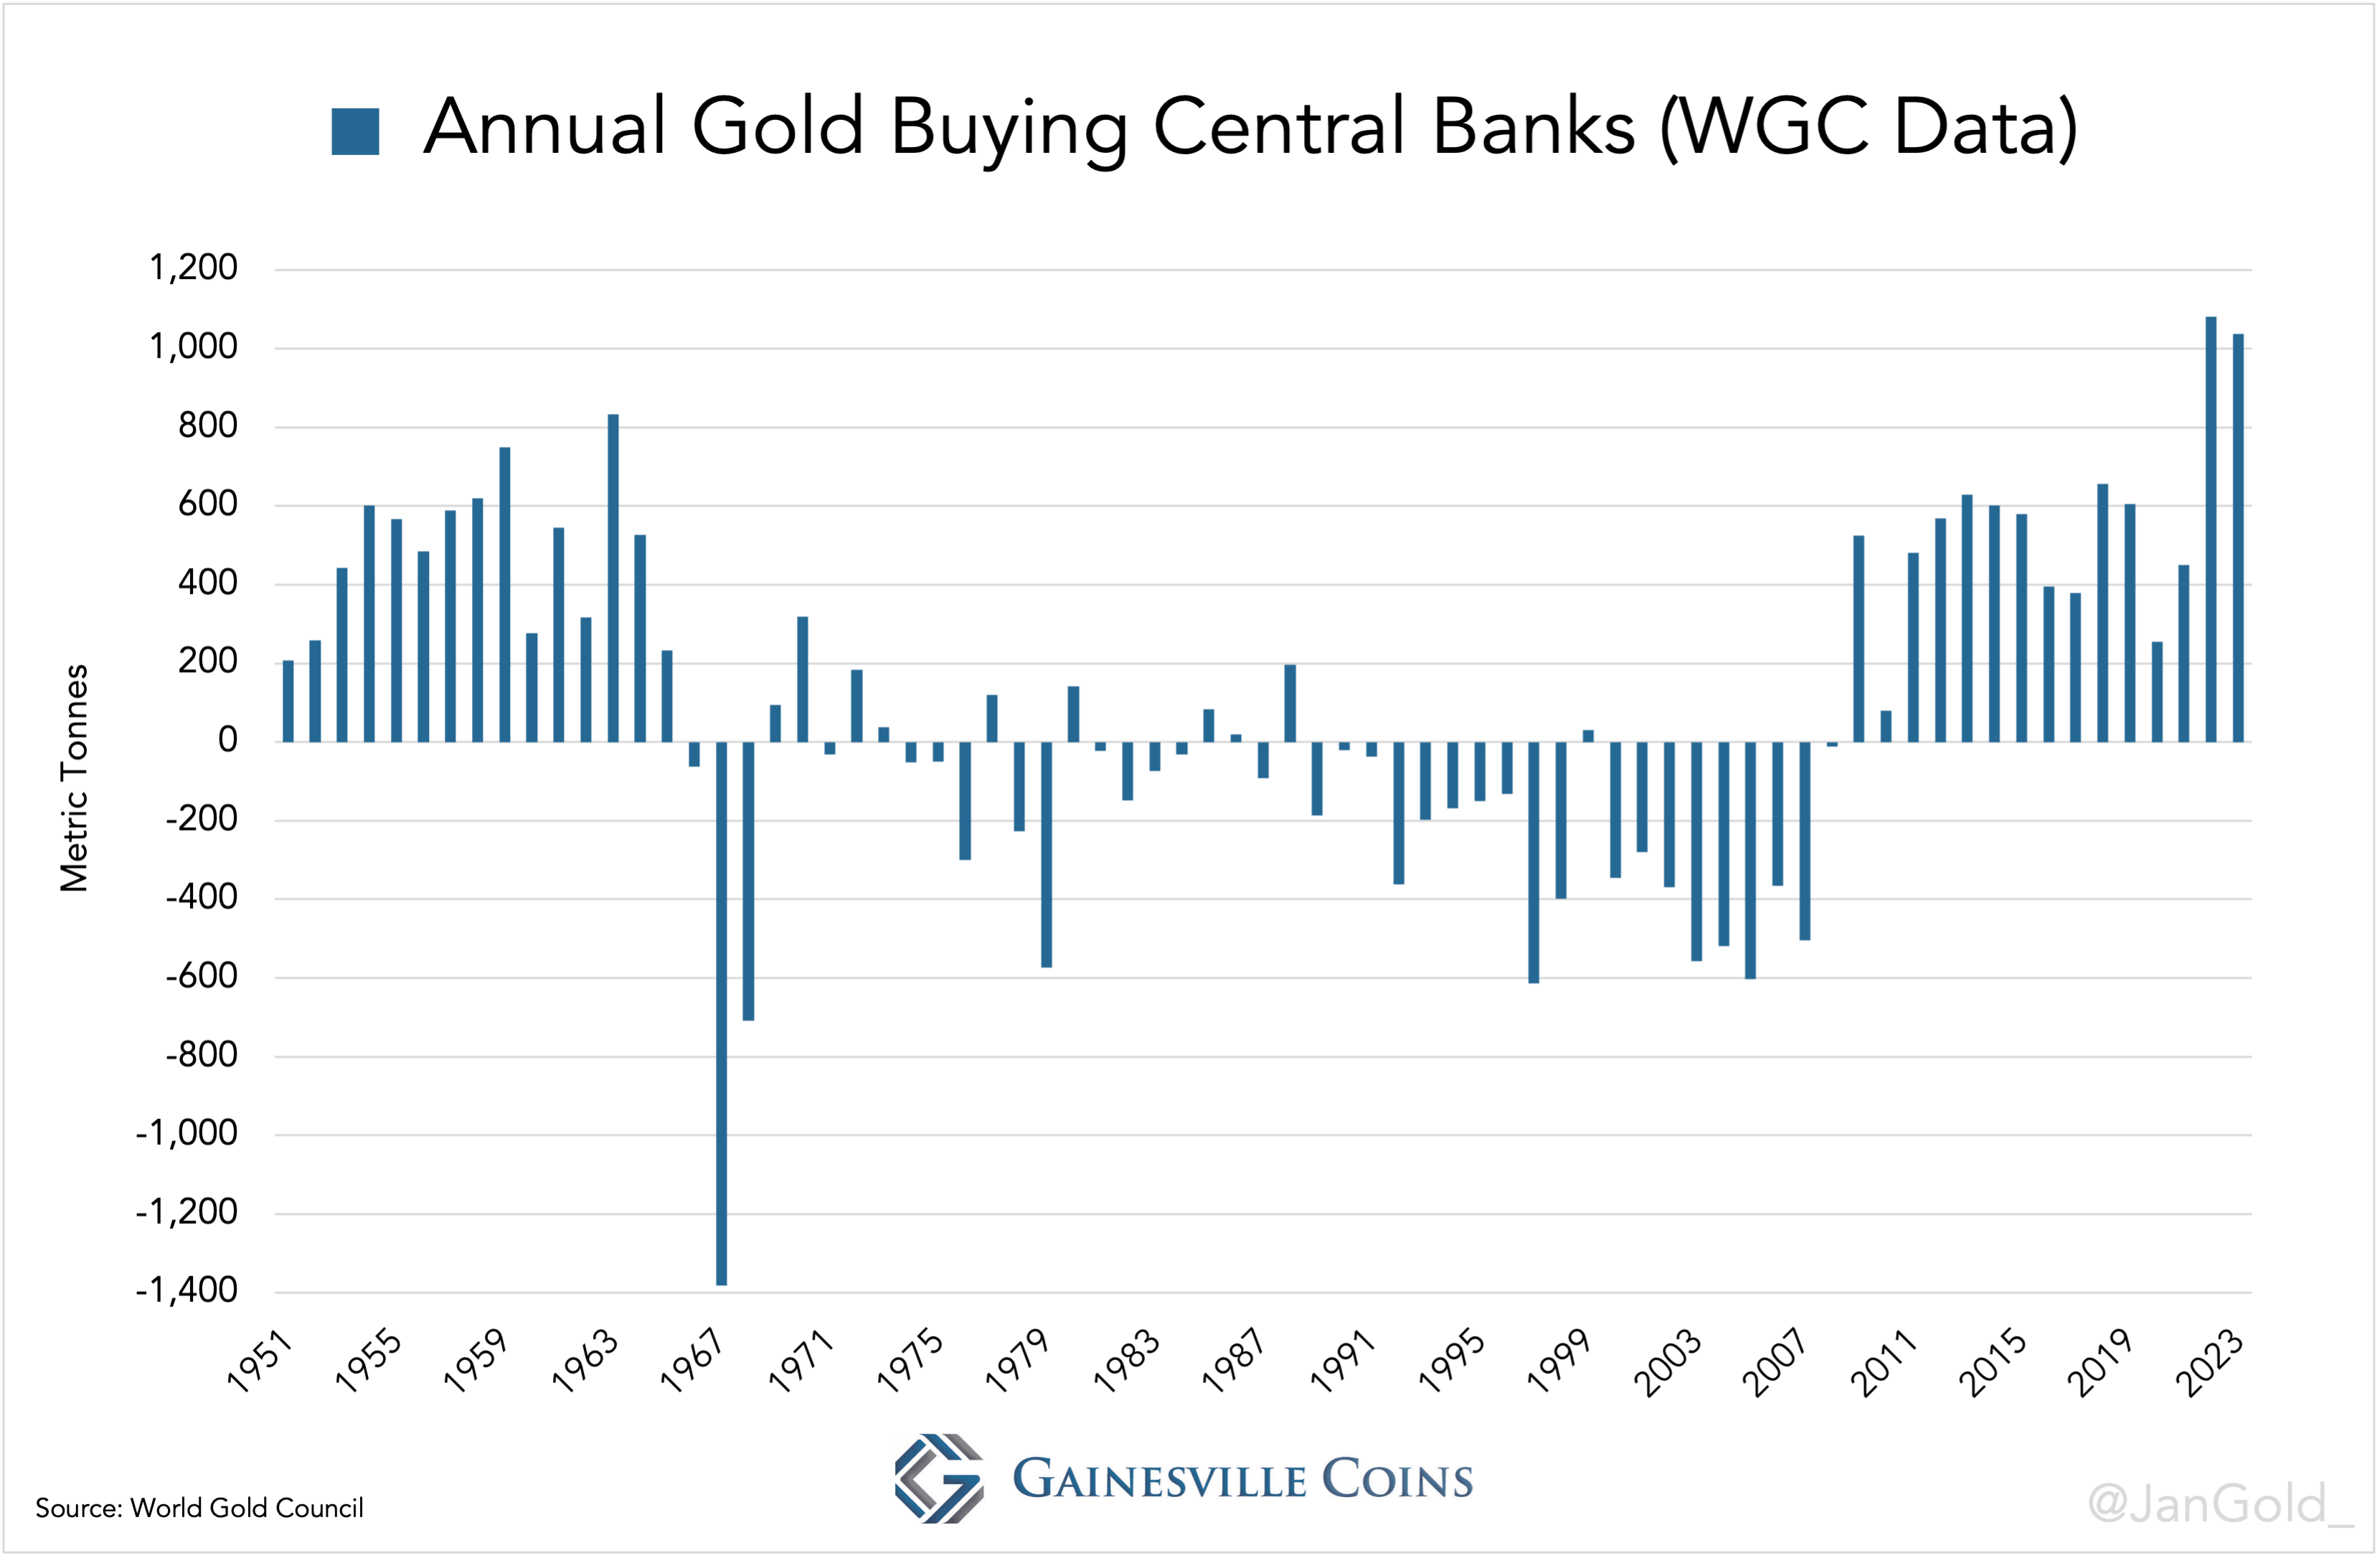
Annual gold buying by all central banks based on data by the World Gold Council. Due to exceptional strong buying by the PBoC, total central bank gold buying reached record levels in 2022.
An Explosive Gold Market
Chinese massive gold buying over the past two years have fundamentally changed the gold market. Whereas before 2022 Western institutional supply and demand was driving the price of gold and the price was more or less stuck to the "real yield" (10-year US TIPS interest rate), ever since the war gold has been less sensitive to real yields and follows its own path. This divergence, according to my analysis, has been created by China that has become one of the main driving forces of the gold price.

The price of gold versus the 10-year TIPS yield. Data up till March 19, 2024.
In the charts below you can see that since the PBoC started buying gold in size—in the second half of 2022—the price has been trending up, all the while the West was a net seller (previously the West would be a buyer when the gold price rose). As the gold price went up from $1,736 dollars an ounce in July 2022 to $2,034 in January 2023 the West was dishoarding, as evidenced by outflows from ETFs and net exports from wholesale markets in London and Switzerland*. Kindly note, monetary gold flows—such as the PBoC repatriating metal from abroad—do not appear in global trade statistics. All visible flows relate to non-monetary gold.
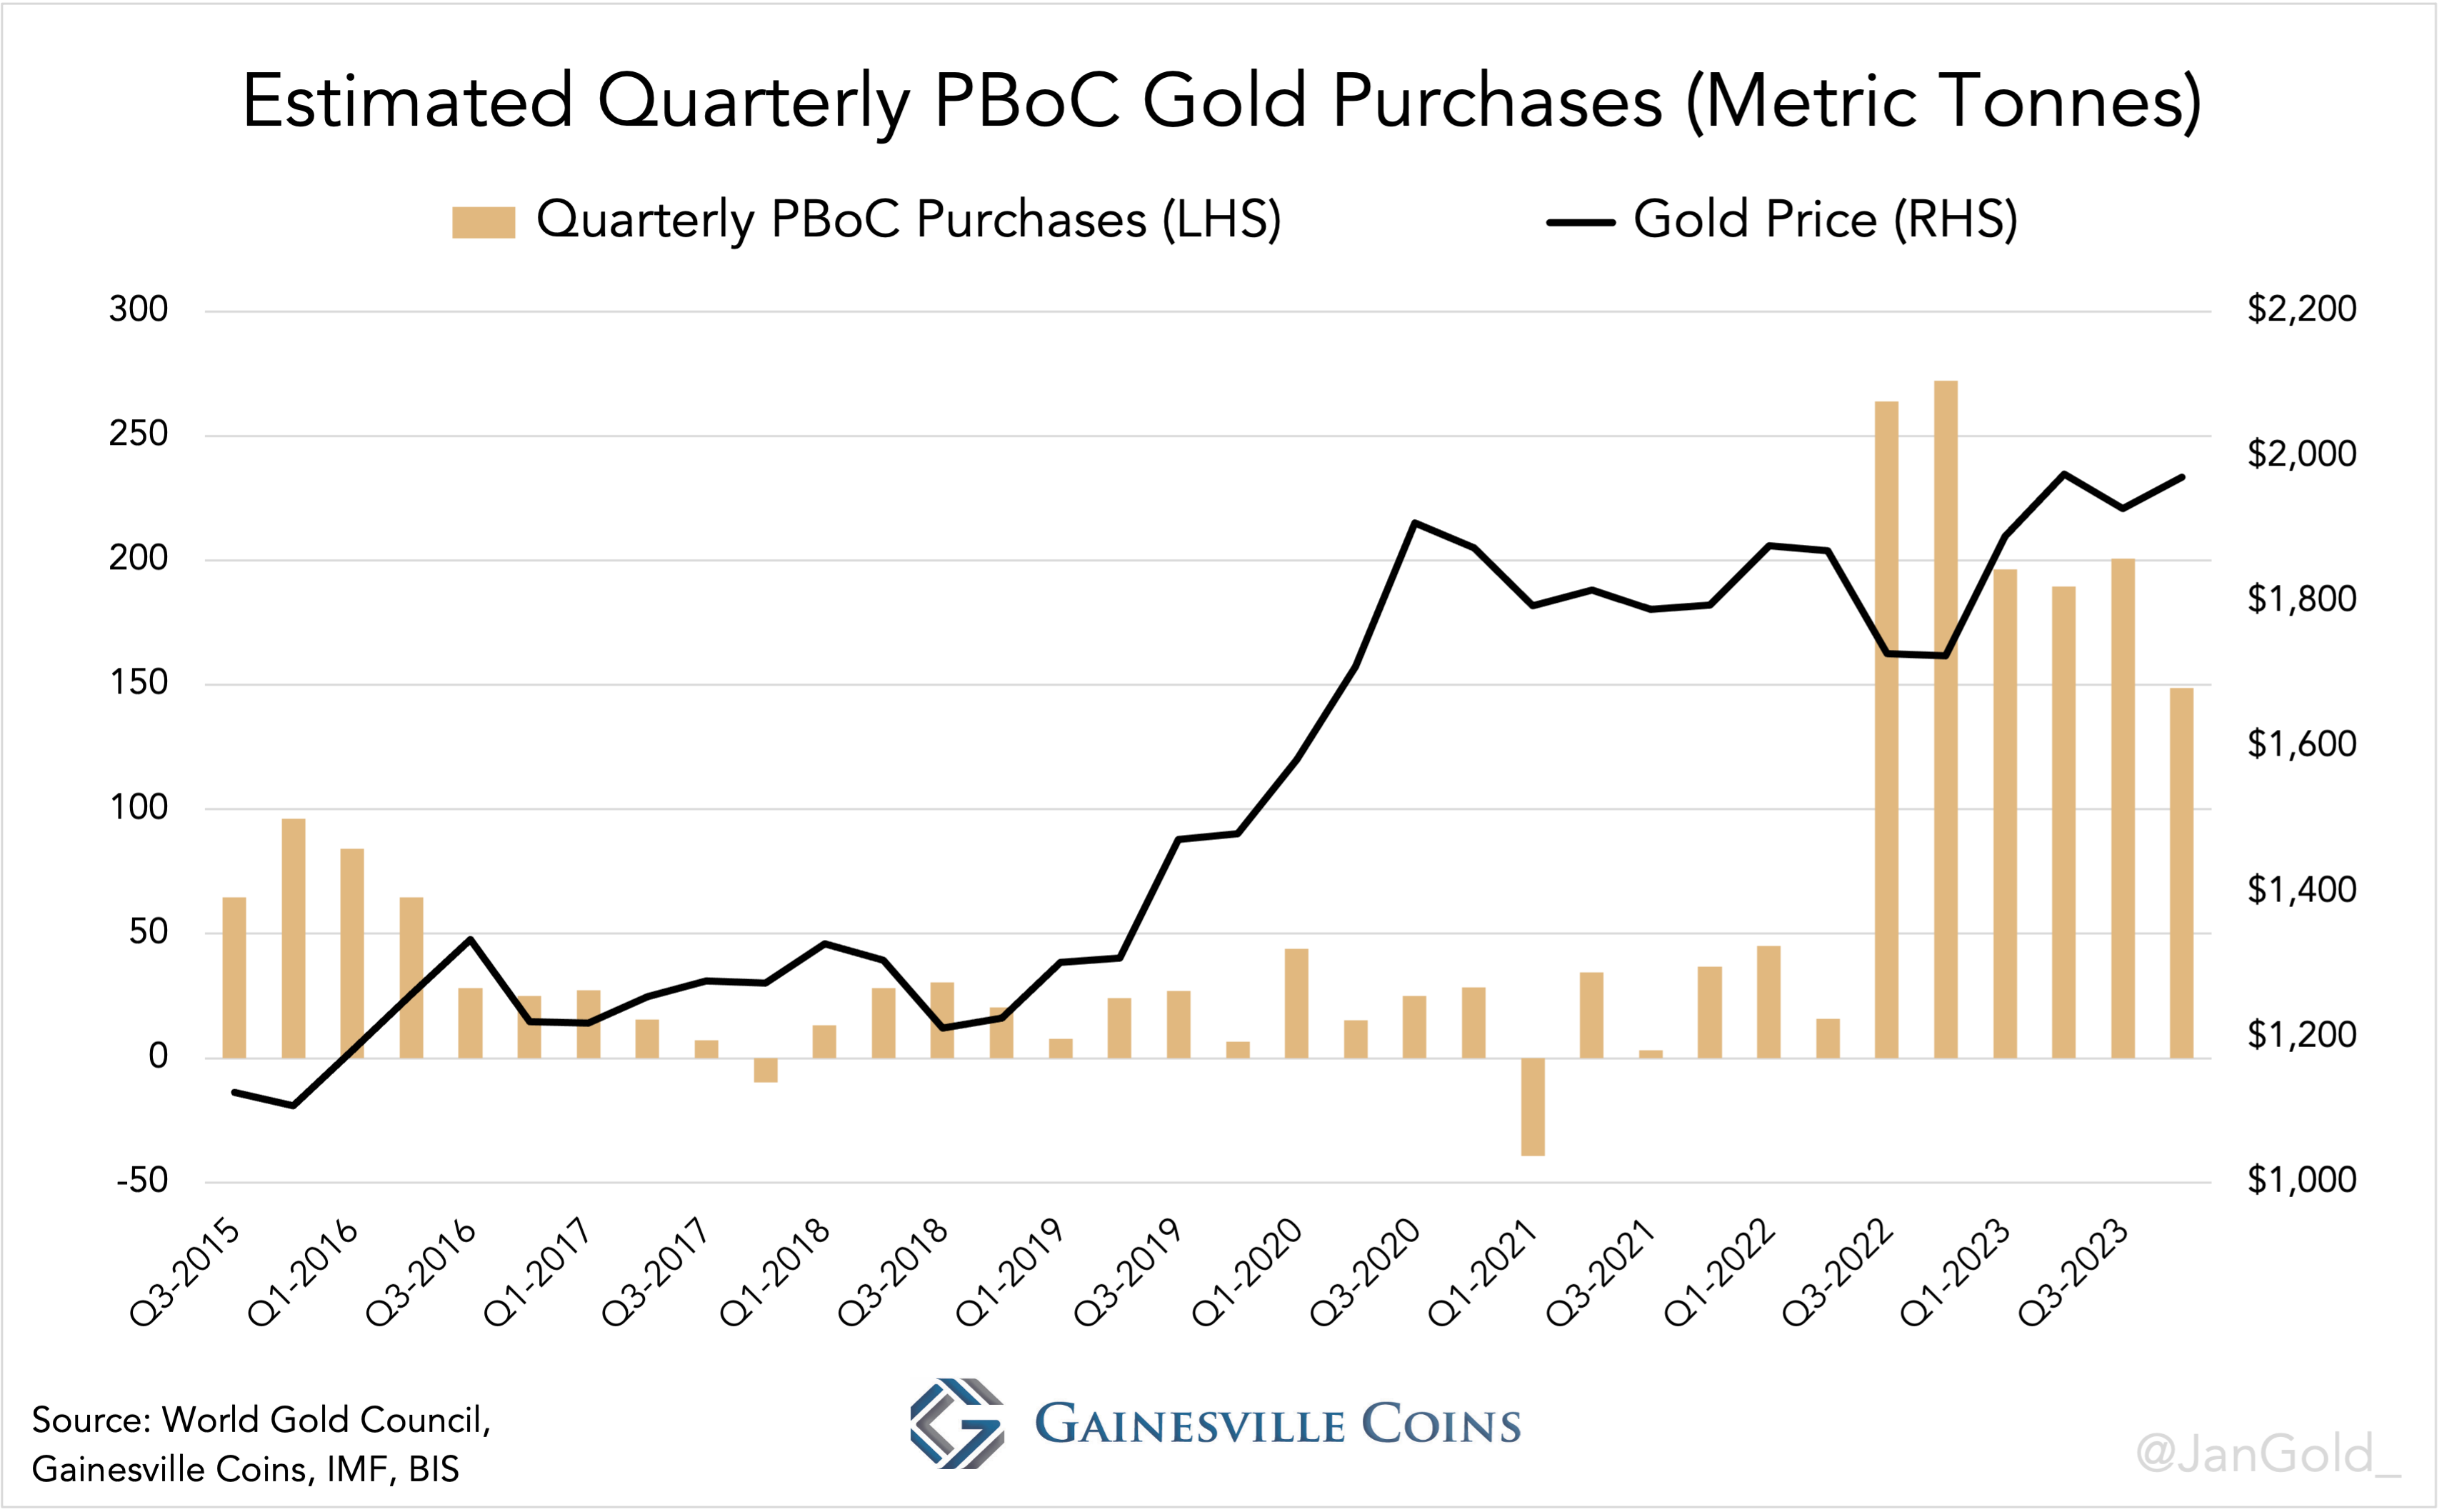
Estimated quarterly PBoC gold buying. Data up till Q4 2023. Possibly, PBoC purchases have been captured by the WGC with a small lag.

Western gold ETFs inventory versus gold price. Data up till February 2024.

UK and Switzerland (both trading and storage hubs) net gold imports through January 2024.

UK net gold imports through January 2024. We can see December 2023 was an outlier in the new trend as the UK net imported 110 tonnes.
Worth noting is that since 2022 total net exports from the UK are roughly equal to the UK’s net export to the East. Increasingly, gold flowing out of London is bypassing Switzerland and is shipped directly to Asia where the 400-ounce bars from the London Bullion Market are recast into 1 Kg bars for the regional market. Global refining capacity is shifting East as well.
The UK’s largest clients in the East, during the period we are discussing, were India, China, and Hong Kong. India, though, is still price sensitive. The Indians didn’t drive up the price.
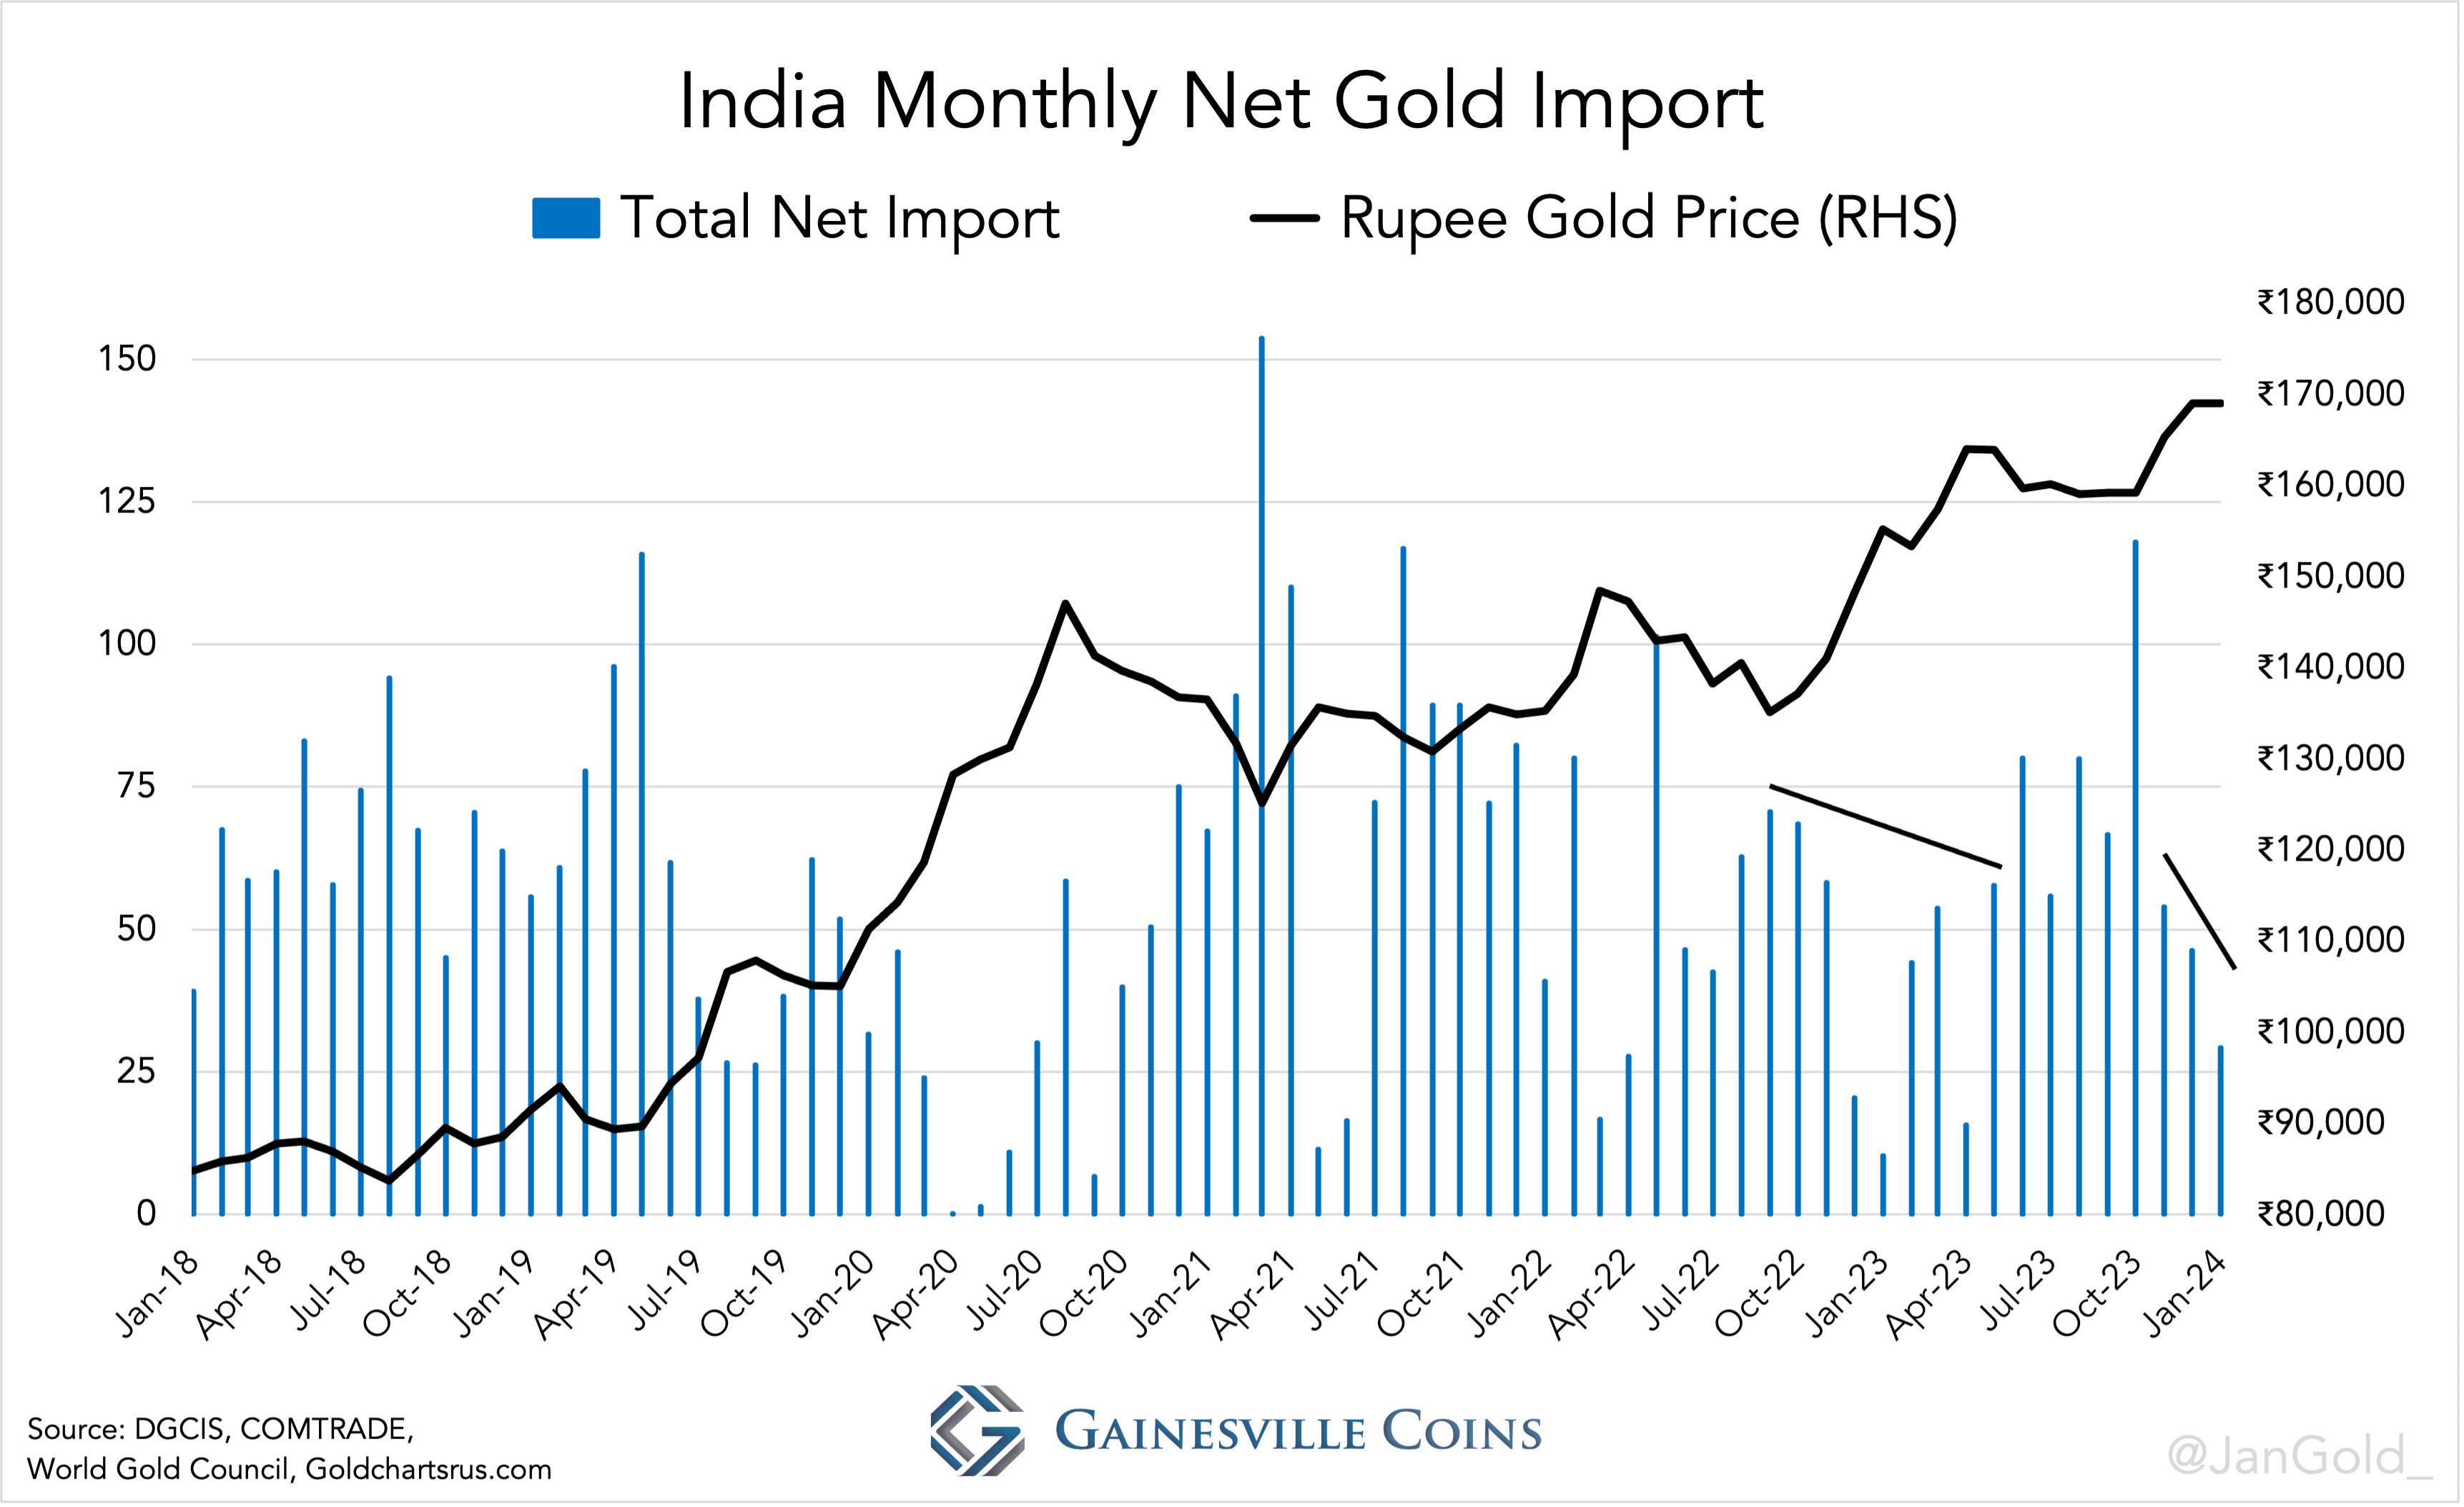
India net gold imports through January 2024.
Hong Kong did show increased gold imports while the price went up since 2022. This can be either due to the PBoC buying gold in Hong Kong (monetizing it in Hong Kong and then repatriating it off the radar), affluent Asian citizens buying and storing gold there, or bullion banks storing gold there in anticipation of strong demand in the East.
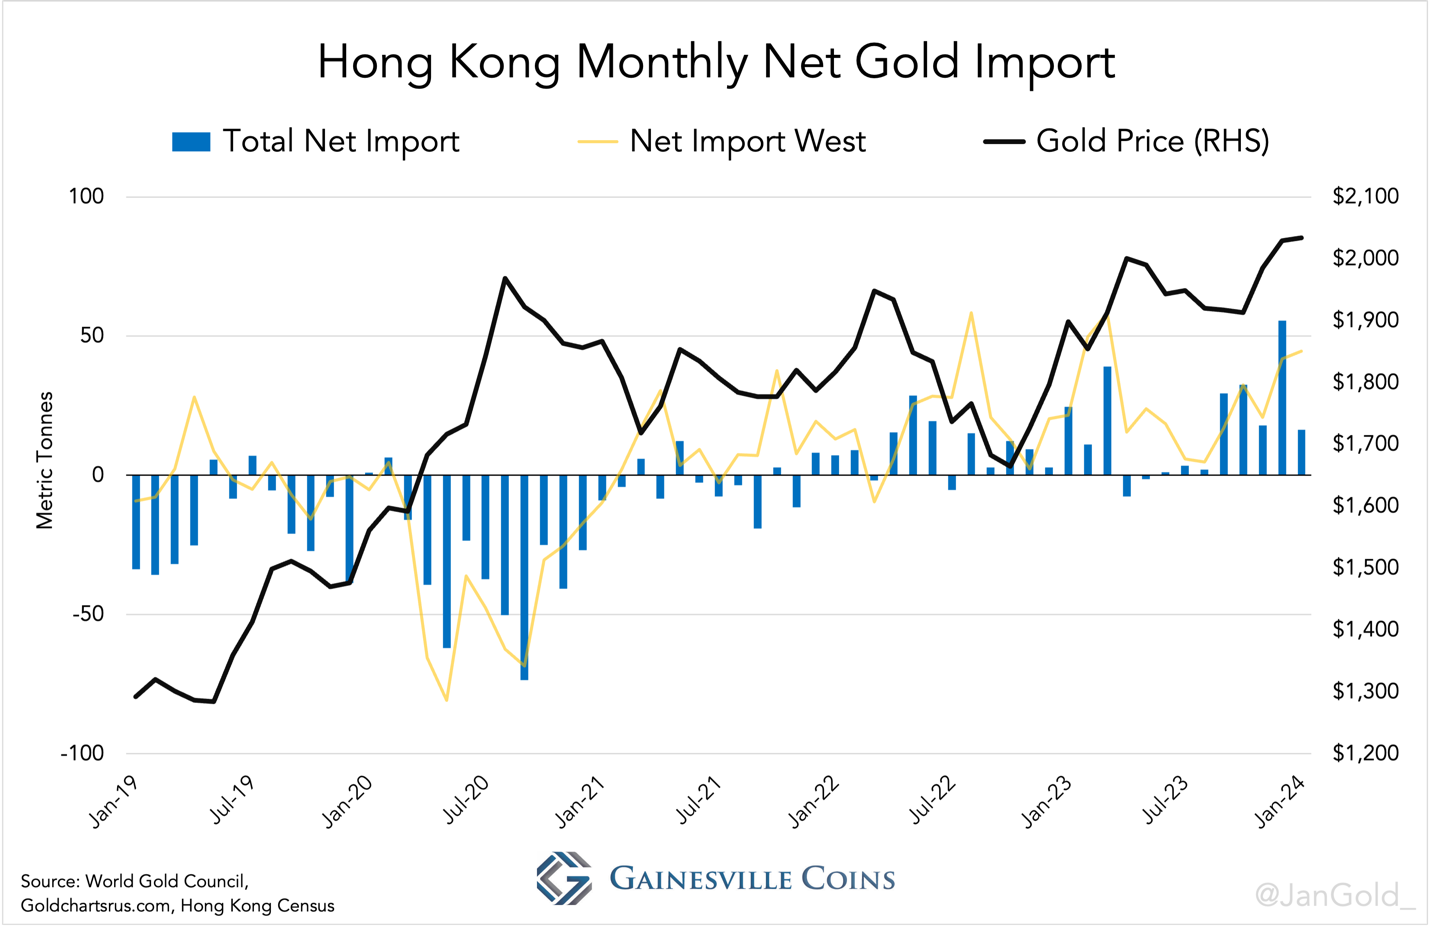
Hong Kong net gold imports through January 2024.
Previously, when the gold price went up Hong Kong would be a net exporter and the West would be its biggest customer (see 2020 in the chart above). But since 2022, the West is a supplier while the gold price rises. Likely, Hong Kong has also become one of the driving forces of the gold price.
Turning to the mainland. As the real estate sector in China began crumbling late 2021, Chinese people started changing their gold buying behavior and lost their long-standing sensitivity for the price. One explanation could be that because of capital controls Chinese investors have few places to go other than the local stock market, real estate, and gold. And when the former two are in the doldrums, which is currently the case, the latter attracts more attention.
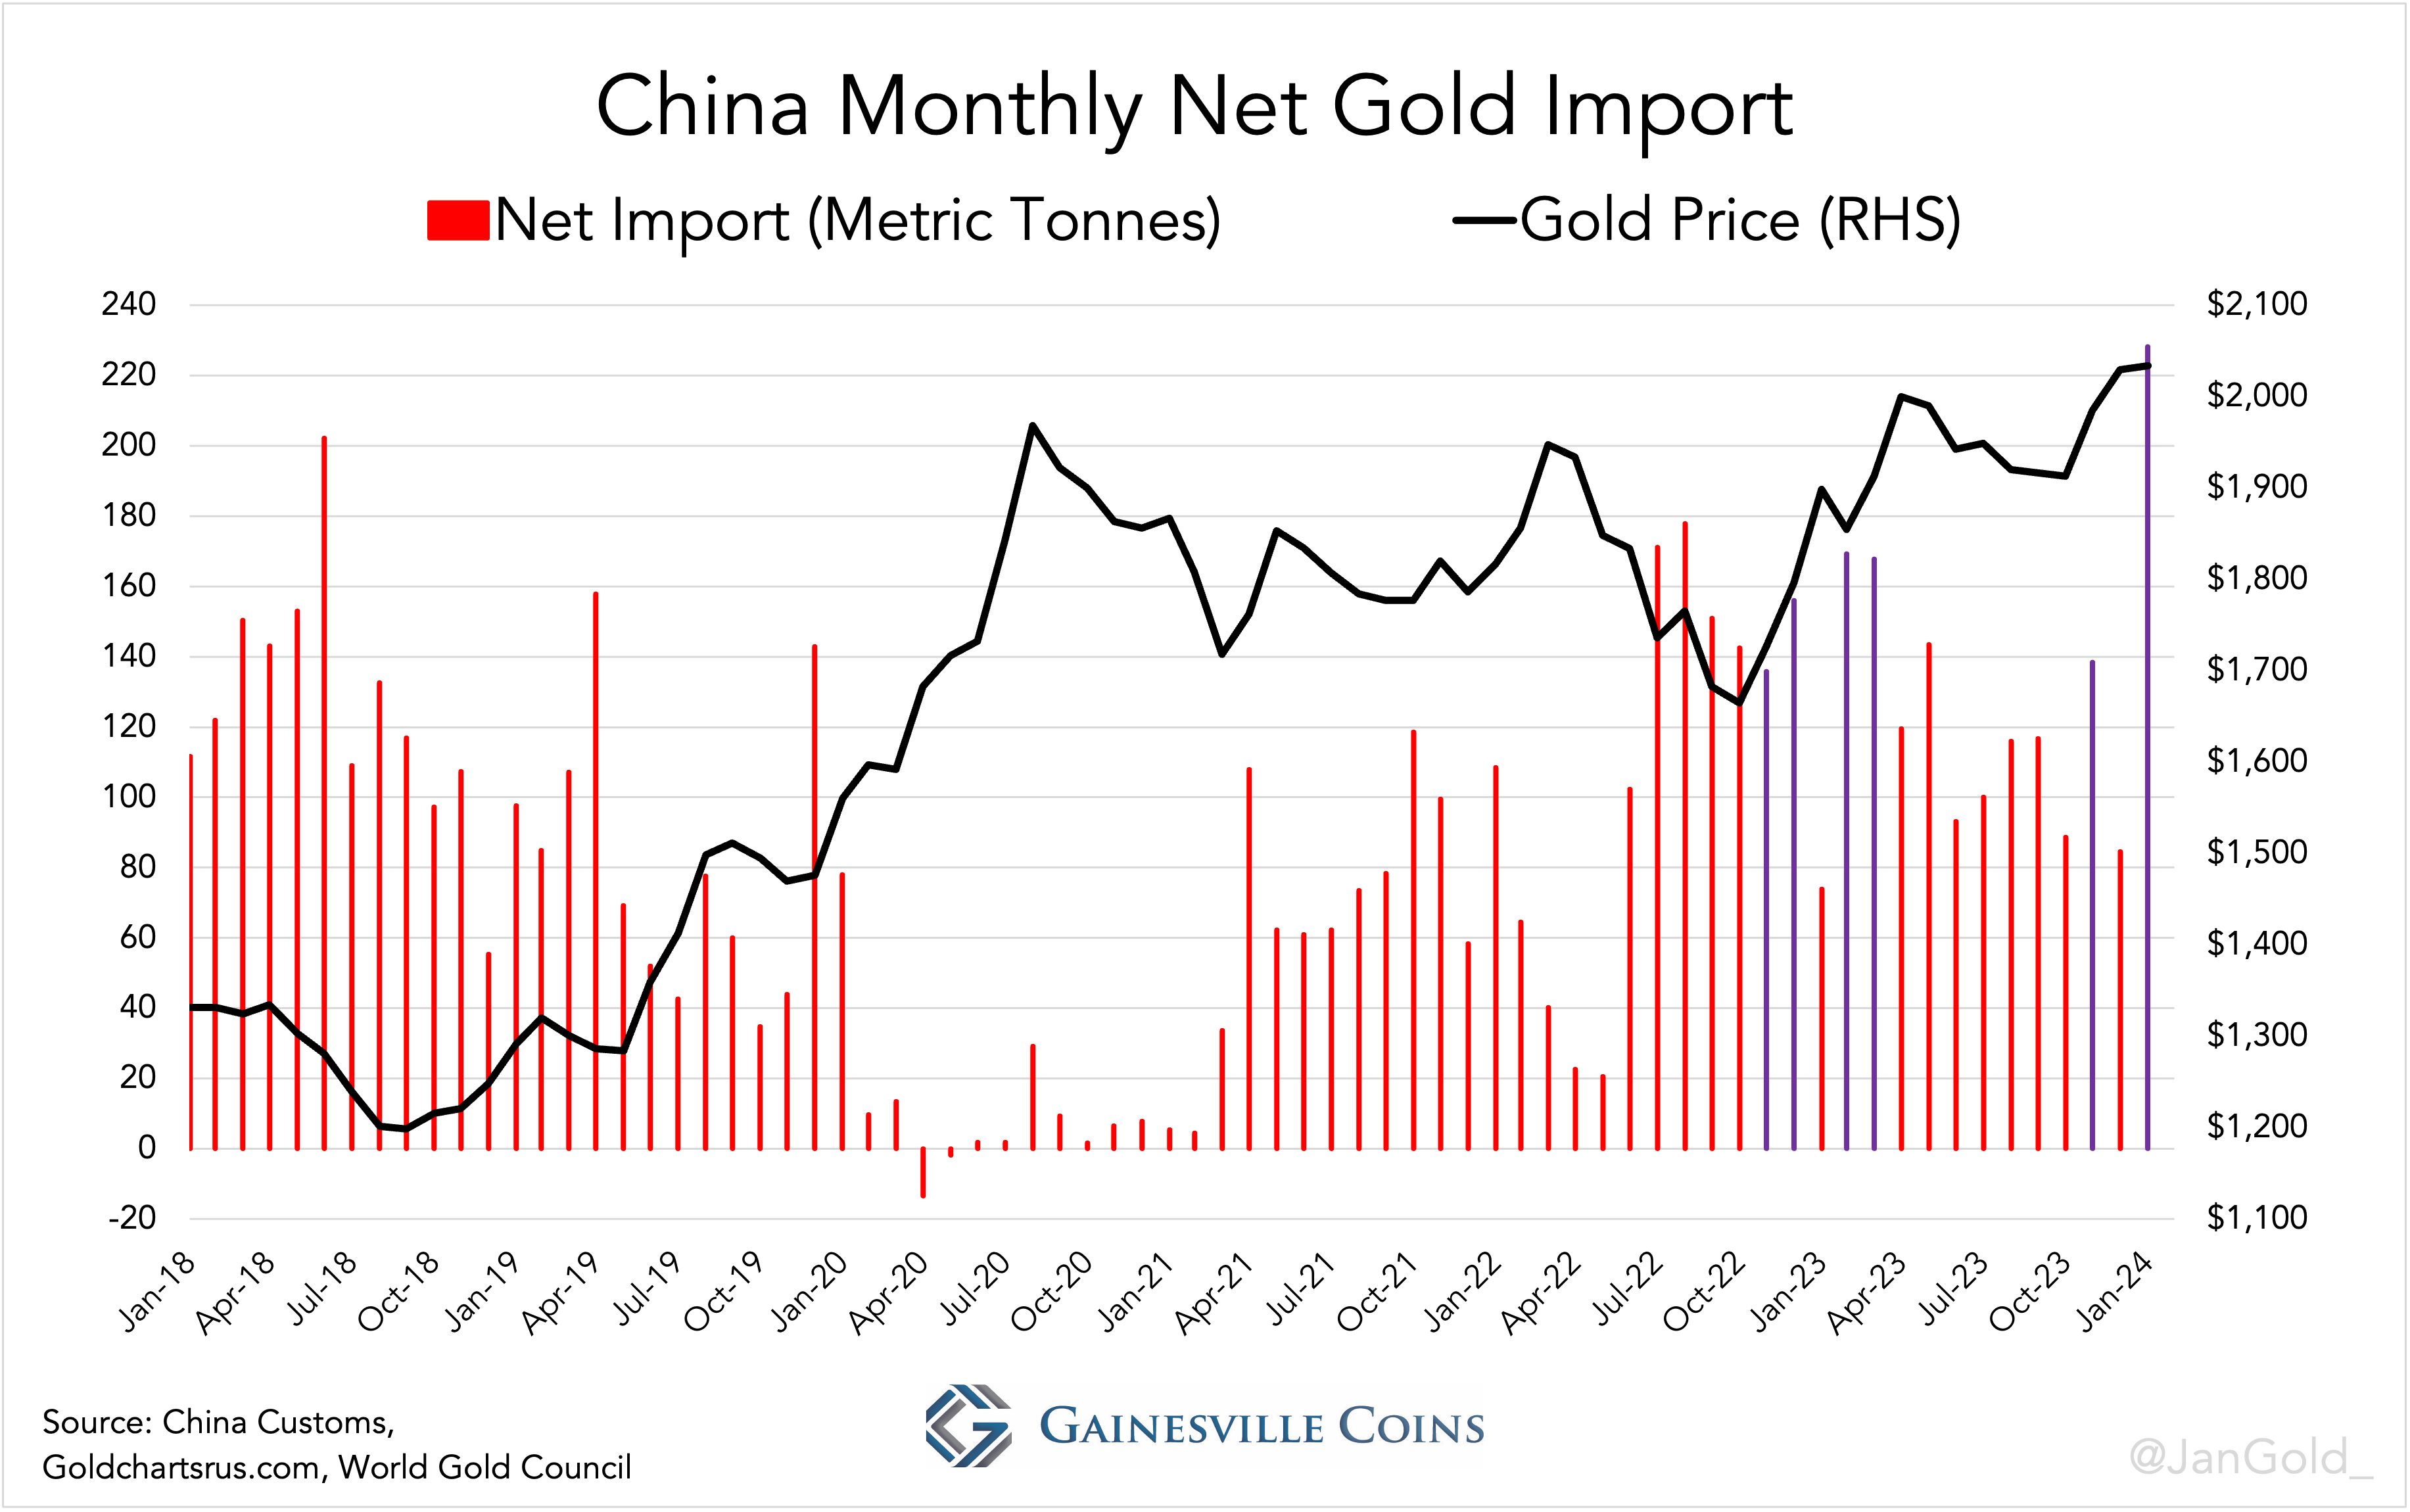
China net gold imports through January 2024. The purple bars show exceptional strong demand coinciding with an escalating price. None of the publicly disclosed gold imports are destined for the PBoC. The Chinese central bank buys gold abroad and repatriates that gold outside the scope of customs statistics.
In the above chart you can see how Chinese gold investors have changed, shifting from increased buying when the West sells, providing a floor for the price, to strong buying when the price is ascending, being a driving force. Compare the periods from mid-2018 until mid-2020 and early 2022, when the price went up and Chinese imports plummeted, to the periods from mid-2022 through early 2023 and late 2023 until January 2024, when the price went up and imports increased or remained robust.
The same can be seen in Shanghai gold premiums. Before 2022, these premiums fell when the price rose and vice versa. Now premiums stay positive during gold rallies. For our analysis we use the uncensored premium on the Shanghai International Gold Exchange, not the manipulated premium on the Shanghai Gold Exchange (as explained here).

Shanghai gold premiums versus London spot. SGE is the Shanghai Gold Exchange, SGEI is the Shanghai International Gold Exchange.
Conclusion
My conclusion is that mainly the PBoC and the Chinese private sector have been driving the gold price higher since the second half of 2022. Besides the obvious reasons for owning gold, I have outlined why Chinese people have altered their gold investment strategy. But what about the PBoC?
Strong covert purchases by the PBoC reflect hidden de-dollarization. Although the dollar is still the world’s premier reserve currency, China and other countries are trying to move away from it. The weaponization of the dollar is a threat to their dollar reserves, as is the debt spiral the US has entered.
What the PBoC is worried about—next to their dollars being "frozen" by the West—is that the Federal Reserve will be forced to drastically lower interest rates and let inflation run hot. At the time of writing the US federal debt stands at 122% of GDP and with interest rates at 5% is not sustainable. Due to interest expenses the fiscal deficit is out of control, which feeds back into the debt load—the essence of a debt spiral. One of the few solutions is to set interest rates lower than CPI and let the debt inflate away, as was done in the aftermath of the Second World War.
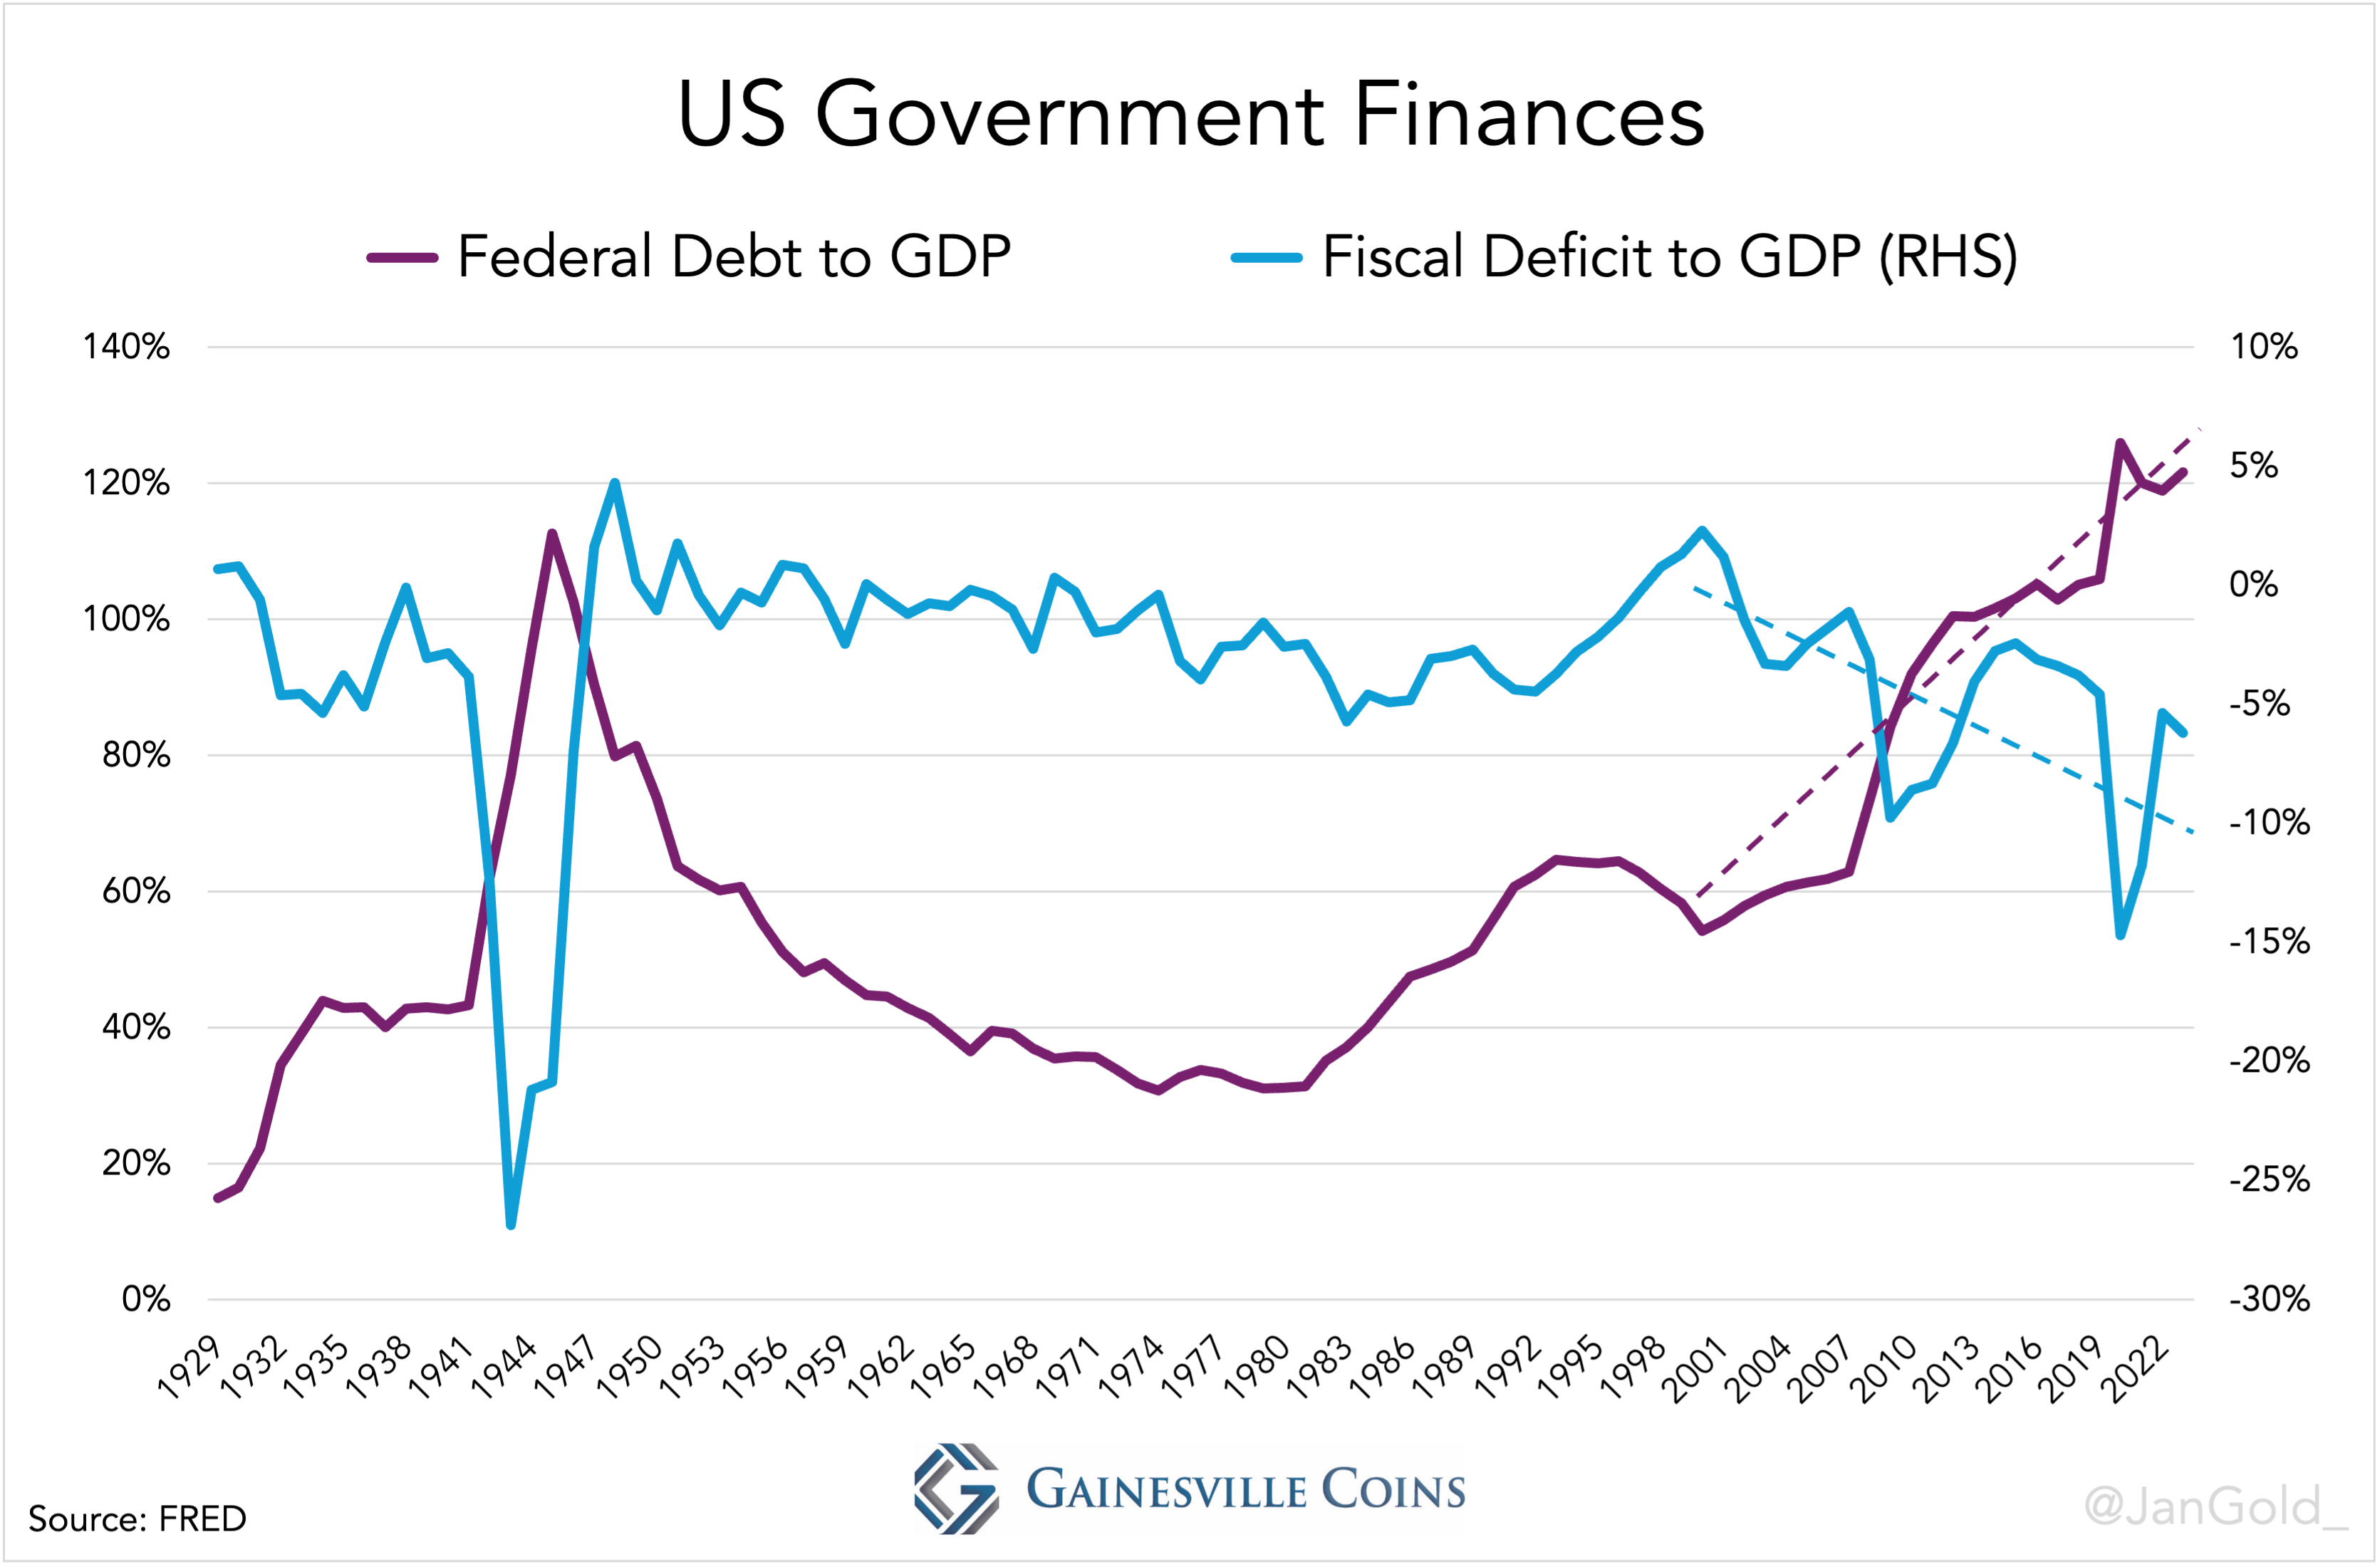
US government finances. In the 1950s yield curve control lowered the US Federal debt to GDP from 115% to 40%.
The bottom line is that countries that are swamped in debt can’t stomach high interest rates. Data from all over the world reveals a correlation between total debt levels and interest rates: countries with high debt levels, unsurprisingly, have low rates.

Total debt levels and interest rates. H/t Jeroen Blokland.
Inflation in the US appears to be sticky, staying above 3%, creating a problem for savers in dollars. I’m quite sure the PBoC is aware of this dynamic and hence in a hurry to buy gold that can’t be arbitrarily devalued.
China’s influence on the gold price in the past two years should be clear, though what I’m not completely certain of is who’s driving the most recent rally that started late February. Initially I thought it was speculators on the COMEX. Open interest of gold futures skyrocketed exactly when the price started climbing. But if it was purely the futures market driving the price higher, we would see fingerprints in “the basis” (the spread between the futures and spot price). However, the basis shows nothing of that sort, according to data by Monetary Metals. It seems as if futures and spot traders are both driving up the price.
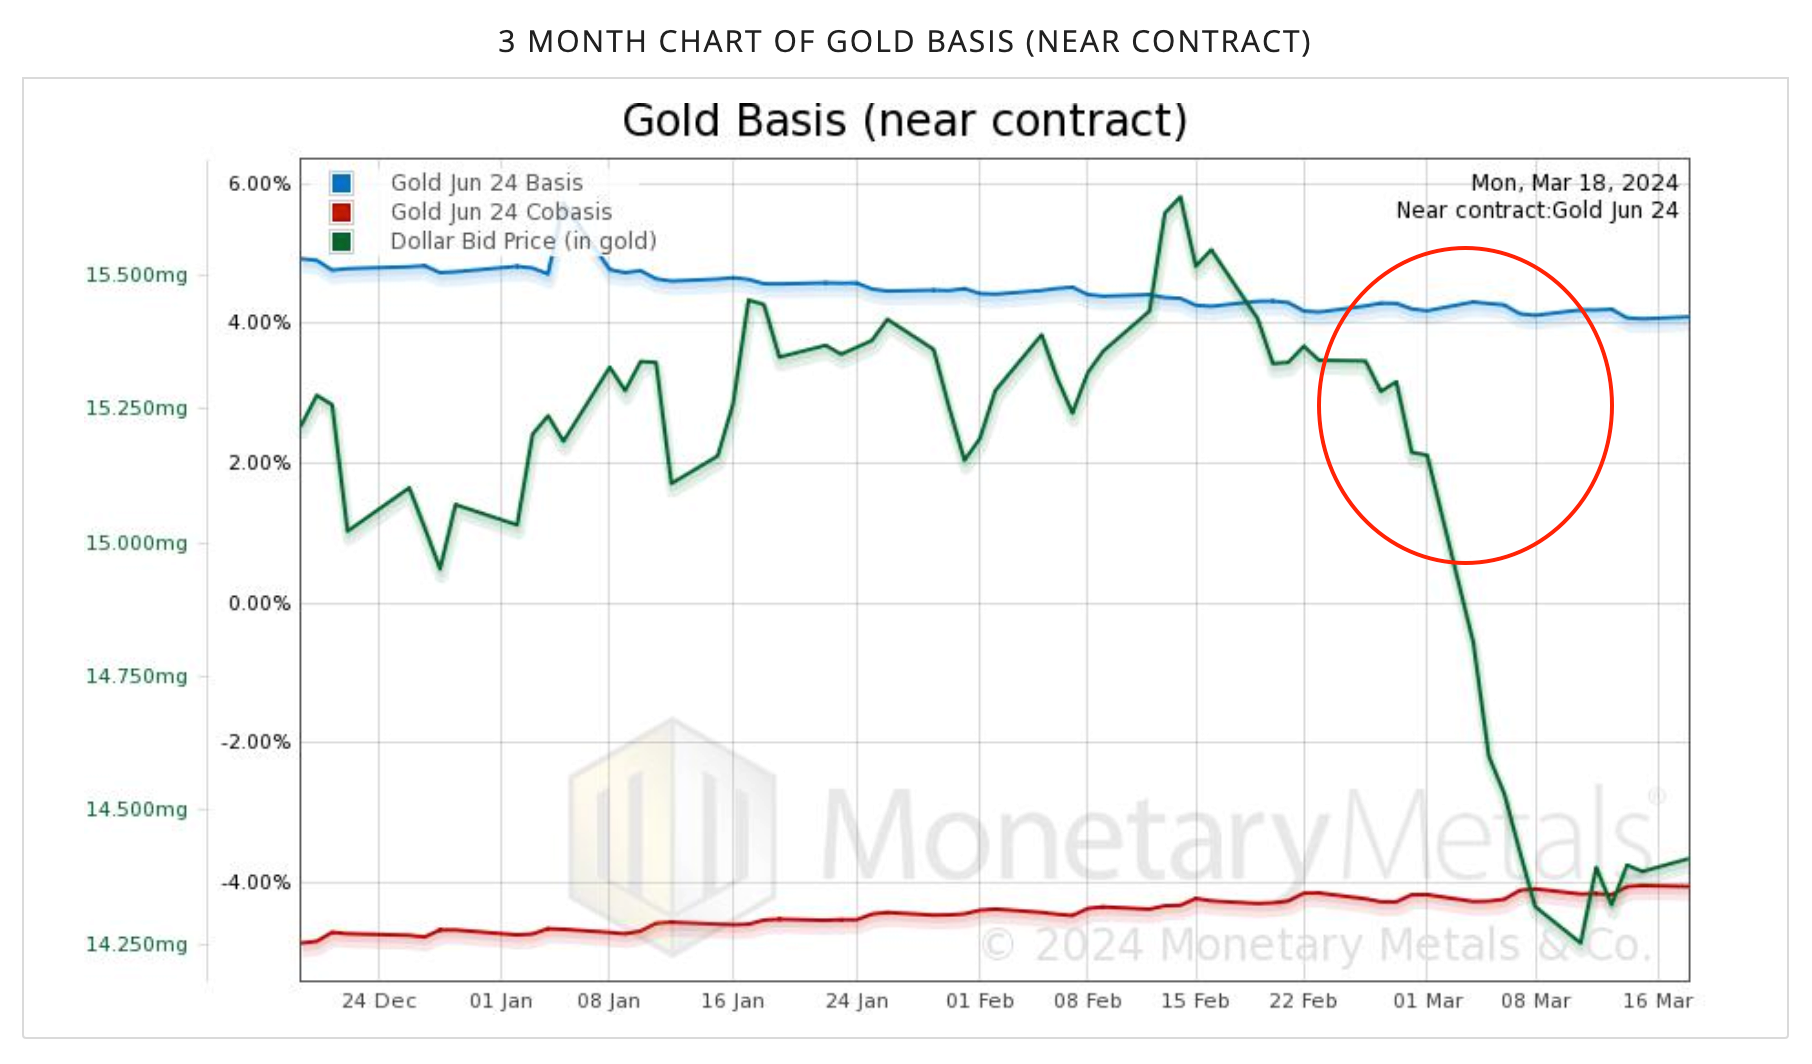
Gold basis, courtesy of Monetary Metals.
We will know more when trade and supply and demand statistics for Q1 2024 are released. Quite possible, the Chinese are flexing their muscles once again, forcing gold into the next stage of the current bull market.
As the gold price will be making new all-time highs I expect more Western investors to join buying gold, through ETFs and outright, as they will fear currency debasement just as the Chinese central bank. It will be a perfect storm for gold.
*The gold prices mentioned are monthly averages, which I also use for my monthly global gold trade charts.
This article was originally published on Gainesville Coins: https://www.gainesvillecoins.com/blog/pboc-secretly-bought-record-735-tons-of-gold-2023

